Official websites use .gov A
.gov website belongs to an official government
organization in the United States.
Secure .gov websites use HTTPS A
lock (
) or https:// means you’ve safely connected to
the .gov website. Share sensitive information only on official,
secure websites.
The statewide interagency work group that developed the Washington Wetland Program Plan identified the following objectives related to wetland maps and geospatial data:
Improve wetland mapping through implementation of phased mapping efforts.
Develop a web-based mapping system for permit activities.
Inventory wetland status and trends.
Integrate wetland data with web-based data management platforms.
Provide local governments access to mapping tools.
To help address these objectives, we received support from several grants funded by the Environmental Protection Agency (EPA). For example, in 2022 and 2023 we were focused on an EPA-funded grant to conduct a statewide wetland mapping inventory project.
Below you will find information about other past and current wetland-mapping efforts, as well as links to available wetland map products and geospatial data. Each dataset has specific limitations for accuracy and use. It is important to read the limitations described for each dataset and understand their strengths and weaknesses before using the data.
Finding geospatial data
When looking for wetland geospatial data we recommend starting with the spatial data programs of your local jurisdiction, at the city or county level. Some local jurisdictions provide field-verified wetland maps online. Where field-verified wetland data are not available online, most local jurisdictions provide a wetland map based on another dataset, such as the National Wetland Inventory (NWI). These data are a good starting point, but the only way to confirm wetland presence or absence is to get a wetland professional on site.
In general, it is best to apply a nested approach to looking for wetland data by taking the following steps:
Start local: Where available, use wetland inventories and maps that have been completed by local entities. Local efforts may have more current maps from high-resolution imagery, field-verified data, or more improved technology than are available at the state or national level. Look for a county or city web site that provides geospatial data in your area.
Regional/statewide/federal: Where local data are not available, see broader datasets available from state or federal resources, such as those discussed below.
These data often cover larger areas and may be coarser than local data. It is important to understand the caveats and limitations associated with these data, but they are helpful when used in combination with other spatial data, to get a better understanding of wetland potential on the landscape.
Data summary
Use the Coastal Atlas Map to access the following Wetland Data map layers (select "Add/Remove Map Data" and select the Wetlands Data tab):
Modeled Wetlands Inventory for Western Washington: This medium-resolution scale map can be used to look for wetlands in your area. It was modeled from land cover data produced by NOAA's Coastal Change Analysis Program. Modeled wetland inventory data are available for the years 1992, 1996, 2001, 2006, 2011, and 2016. See the "Ecology Modeled Wetland Inventory" accordion below for more information.
Wetland Mitigation Areas: Locations of wetland compensatory mitigation sites required under Ecology's authority from Section 401 of the federal Clean Water Act and/or the state Water Pollution Control Act (Chapter 90.48 RCW). The polygons have been hand digitized by wetland mitigation staff and are based on permit figures, drawings, as-built reports, parcel layers, and site visits. This layer is a work in progress.
Mitigation Banks: Locations of approved and proposed wetland mitigation banks in Washington. The map shows the location of Wetland Mitigation Bank Projects throughout Washington State and allows users to zoom in to bank locations to view bank site footprints. Bank service areas are not currently displayed but can be accessed on the Mitigation bank projects web page.
Simplified National Wetland Inventory (NWI): This layer is derived from the National Wetland Inventory (NWI) and updated periodically for display in the Coastal Atlas. This map displays simplified Cowardin classes from NWI and does not display deep water and other non-wetland habitats that may be included in NWI. The data displayed may not reflect the most current version. Please consult the U.S. Fish and Wildlife Service Wetlands Mapper for the most current data.
Hydrologic Landscape Class: This layer displays hydrologic landscape classes developed by the U.S. Environmental Protection Agency to characterize stream flow vulnerability from climate change. For more information see Hydrologic Landscape Characterization for the Pacific Northwest, USA.
Soils (Clay, Organic, Hydric): With guidance from the Natural Resource Conservation Service (NRCS), Ecology derived three soil layers from the Gridded Soil Survey Geographic Database (gSSURGO). The layers identify areas where organic or clay soils represent major or minor components of a soil polygon. The hydric soil layer shows polygons that are not identified as clay or organic where the soil polygon is classified as hydric by NRCS. For more information on the soil map layers, see the NRCS map unit description web page.
Data limitations
Wetland data layers provided in the Coastal Atlas map have statewide coverage, except for the Modeled Wetland Inventory that only covers western Washington.
Wetland data layers provided in the Coastal Atlas map are for reference, only. The datasets are not meant to be used for regulatory purposes. They are for planning purposes and only indicate the potential for wetland presence. As with all map data, presence or absence of wetland features at any location will always need to be verified in the field.
Data summary
We worked in partnership with NOAA's Coastal Change Analysis Program (C-CAP) to carry out the Wetland Change Analysis project, which was partially funded by an EPA Wetland Program Development grant. To map Washington wetlands more accurately for change analysis, NOAA developed a method to create a Modeled Wetlands Inventory from C-CAP data. The inventory uses ancillary information with the standard land cover classification from Landsat scenes analyzed according to C-CAP protocol. Wetlands land cover classifications were extracted from the overall land cover layer where wetlands were likely to occur and mapped using 30-m pixel resolution.
NOAA applied the improved wetland layer to previous C-CAP analyses that occurred between 1992 and 2016. A change in C-CAP land cover mapping procedures may affect the availability of future modeled wetland inventory data.
The Modeled Wetlands Inventory:
Is more accurate than the National Wetlands Inventory for the location of wetlands larger than one acre, especially in agricultural/pasture, forests, and stream corridors.
Includes a "Potentially Disturbed Wetlands" category for areas that have a high potential to be wetland but have an observed land cover of "pasture/hay" or "cultivated."
Can be used for planning purposes and for initial permit review.
Map data
Use the Coastal Atlas Map to access the Modeled Wetland Inventory map layers (select "Add/Remove Map Data" and select the Wetlands Data tab)
Because of the medium-scale resolution of 30-m pixels, wetlands one acre or less in size may not be mapped.
The data do not identify forested and slope wetlands as well as other wetland types.
The inventory identifies areas that have a high potential to be wetlands. Locations nd boundaries of mapped wetlands are approximate due to the medium resolution scale. The absence or presence of a wetland on the map does not mean that the wetland is actually absent or present.
Data are not available east of the Cascades.
Data summary
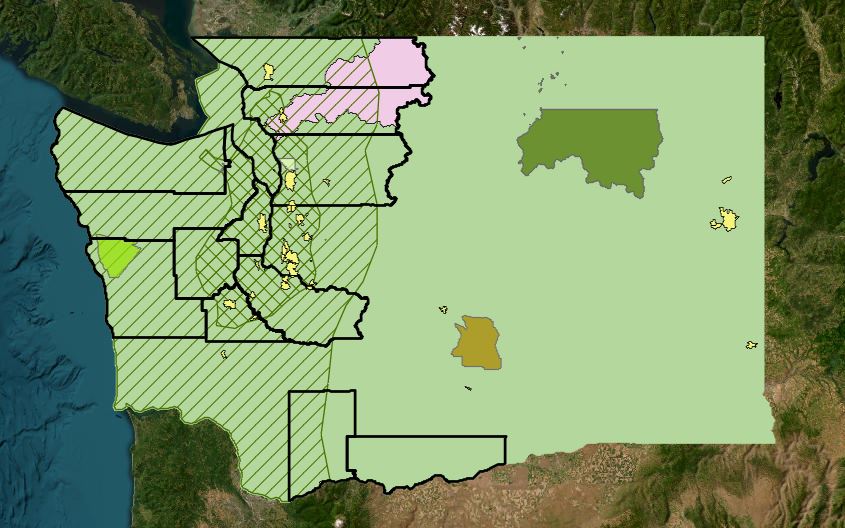
We conducted a statewide survey to inventory wetland maps and mapping efforts, which was partially funded by and EPA Wetland Program Development grant. We were interested in the general areas and regions where wetland-mapping work is completed or underway to gain a better understanding of the status of wetland mapping in Washington. From the completed surveys and resulting discussions, a statewide list of available mapping projects and resources was produced. This list is paired with a web map visualizing broad geographic regions and extents where wetland mapping is occurring.
Data limitations
Data represented in this study were produced on a voluntary basis from project participants.
Data were accurate at the time of collection, contacts and generated data specifics may have changed since this study was conducted.
Wetland information collected during this study were often derived from a variety of resources and should be reviewed for completeness and levels of accuracy before use. We recommend that you verify the data with the associated contacts before use.
Data summary
As part of an effort to improve wetland mapping statewide and with funding from EPA, Ecology collaborated with the University of Washington Remote Sensing and Geospatial Analysis Laboratory (UW-RSGAL) on a pilot project to test semi-automated remote sensing of wetlands, with a focus on improving mapping of forested wetlands.
From this initial effort and with additional funding from the Wetland Science Advisory Group (WetSAG) for Forest Practices, UW-RSGAL developed a novel methodto map the probability of wetland presence using several data inputs called the Wetland Intrinsic Potential tool (WIP). The WIP is now available in the ArcGIS watershed toolbox and has been used to map several areas acrossWashington and elsewhere for planning and research projects.
Ecology recently received funding from EPA to generate medium-scale WIP coverage statewide, while UW-RSGAL is working to generate coarse-scale WIP coverage nationwide.
Generated wetland probability outputs are estimations calculated by the given inputs to a model, all model outputs are not authoritative, and should be field-verified for accuracy.
Model generation is limited by the information and data available to any given location. Model inputs that are valuable in producing accurate and informative outputs include:
Vetted training data for both wetland and upland locations
Elevation data at project-appropriate resolutions and time frames
Improved hydrologic data such as surface water and streams
Rare Plant and Ecosystem Locations displays all publicly available rare plant and rare/high-quality ecosystem locations in the WNHP database. It also includes the WNHP Reference Standard Wetlands layer, which displays wetlands considered to be among the best examples of specific wetland types based on their ecological integrity. This map application replaces the previous WA Wetlands of High Conservation Value map viewer.
Ecological Integrity Assessment Data presents Level 1 and Level 2 Ecological Integrity Assessment (EIA) data. EIAs measure the ecological condition of upland and wetland ecosystems using WNHP’s standardized metrics to categorize sites into condition classes. Level 1 EIAs are entirely remote sensing/GIS-based, while Level 2 EIAs are based on rapid, mostly qualitative field data.
Precise species boundaries may be masked to protect the locations of sensitive species.
The Known Rare Plants and Rare & High-quality Ecosystems layer includes EOs observed within the last 40 years. The Historical Rare Plants and Rare & High-quality Ecosystems layer includes EOs last observed 40+ years ago. For more information concerning EO data, please reference the EO GIS metadata document.
Data summary
PHS on the Web is a Washington Department of Fish and Wildlife (WDFW) web-based, interactive map where you can find basic information about the known location of Priority Habitats and Species (PHS) in Washington State. PHS is a source of best available science that can inform local planning and conservation.
Wetlands are included as Priority Habitat polygons. Some wetlands may include observations or data collected by WDFW biologists in the field. Use the Priority Habitats and Species (PHS) on the Web to find information about known locations of Priority Habitats and Species in Washington. Users can navigate to an area of interest and use one of the selection tools to generate a PHS report showing the Priority Habitats and Species mapped in that area.
Data limitations
The species and habitats that appear on the map are informed by WDFW's PHS List. The map displays known locations of Priority Habitats and Species that have been provided to WDFW by agency biologists and other sources of scientific data about species and habitat locations. Data are updated as new information is gathered and verified in the field. This map should not be considered an exhaustive survey of all fish and wildlife presence.
The data displayed on PHS on the Web are for informational purposes only. WDFW strongly recommends a field visit by a fish and wildlife biologist or habitat expert to make determinations about species presence, absence, or locations. Species locations change over time, not every parcel has been surveyed, and biologists add new field observations on a regular basis.
PHS maps do not provide an official agency determination of the potential impacts to fish and wildlife of a specific project.
PHS map data are meant to serve as a starting point to identify priority habitats and species. They are not meant to replace or preempt more detailed field-based, site-level mapping.
Data summary
The National Oceanic and Atmospheric Administration (NOAA) Coastal Change Analysis Program (C-CAP) produces standardized medium and high-resolution (30m & 1m) land cover and change products for the coastal regions of the U.S. and its Territories. C-CAP products inventory coastal intertidal areas, wetlands, and adjacent uplands with the goal of monitoring changes in these habitats.
The use of standardized data and procedures assures consistency through time and across geographies. C-CAP data form the coastal expression of the National Land Cover Database (NLCD) and the A-16 land cover theme of the National Spatial Data Infrastructure. The data are updated every 5 years.
Data limitations
C-CAP datasets are not jurisdictional or intended for use in litigation. While efforts have been made to ensure that these data are accurate and reliable within the limits of current technology, NOAA cannot assume liability for any damages or misrepresentations caused by inaccuracies in the data, or as a result of the data to be used on a particular system. NOAA makes no warranty, expressed or implied, nor does the fact of distribution constitute such a warranty.
This is a national and regional data set that should be used only as a screening tool for very local or site-specific management decisions. Small features and changes should be verified with a higher-resolution data source.
National Land Cover Data (NLCD)
Data summary
The National Land Cover Database (NLCD) provides nationwide data on land cover and land cover change at a 30m resolution with a 16-class legend based on a modified Anderson Level II classification system. Legacy NLCD includes map products characterizing land cover and land cover change across nine epochs from 2001 to 2021 (2001, 2004, 2006, 2008, 2011, 2013, 2016, 2019, and 2021) for the conterminous U.S. The 2021 suite of NLCD products follow the same protocols and procedures of the previously released NLCD epochs (2001-2019), are directly comparable to the 2019 release across the full time series, and are suitable for multi-temporal analysis.
NLCD 2021 does not yet contain updated products for Alaska, Hawaii and Puerto Rico
Land cover statewide Ecopia Data 2021-2022 3 ft raster
Data summary
This statewide 3-foot raster Land Cover product was produced by Ecopia for the Washington State Geospatial Program Office (GPO). Ecopia extracted and digitized 7 different land cover classes for the entire state using high-resolution statewide imagery from 2021-2022. It is available to the public at the Washington Geospatial Data Portal.
Land Cover Classes:
Unclassified
Impervious
Impervious, covered by trees
Shrub/low vegetation
Tree/forest/high vegetation
Open water
Railroad
Data summary
The US Fish and Wildlife Service produces and distributes maps and other geospatial data on American wetland and deepwater habitats, as well as monitors changes in these habitats through time. This information is available to the public through two primary datasets: the wetlands mapper and wetlands status and trends reports. These provide complementary information on wetland and deepwater habitat type, location, and trends to support research, land management planning and analyses, policy development, and modeling activities.
Data limitations
Please review the NWI data limitations page hosted by USFWS. Here you will find important information regarding the data limitations, exclusions, and precautions regarding NWI data.