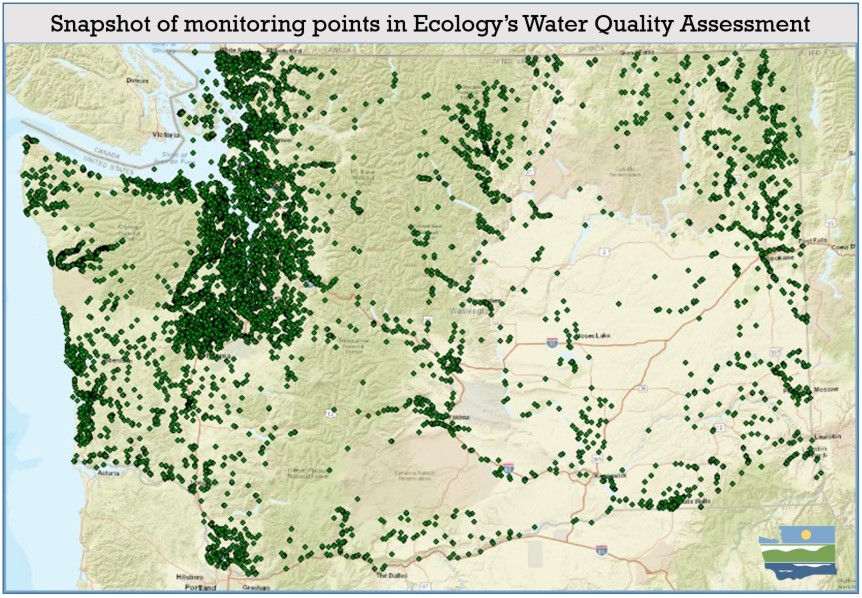
With 65 million data points analyzed and loaded into an online database, the Washington Department of Ecology is now sharing the state’s draft Water Quality Assessment. Taking the form of an interactive online tool, the Assessment pulls together existing data for fresh and marine water.
Ecology uses this vast database to categorize rivers, lakes, streams, and marine waters as either clean or polluted, and then prioritize cleanup efforts for polluted waters, or determine if more data is needed. Analyzing water quality data also helps Ecology understand where the water is getting cleaner. The Assessment is used by tribes, federal, state, and local governments, and stakeholders to design monitoring programs and water quality improvement projects; incorporate the data into other environmental reporting; and to share successes in water quality improvement efforts.
The new draft Assessment is different in many ways from past Assessments:
- Updated methodologies were used to review data.
- Analyzed significantly more data than in the previous Assessments.
- Improved data analysis by using a new automation tool.
Water quality monitoring is often located in areas where pollution problems are known to exist and where cleanup plans are in place.
Ecology’s Assessment is one of the most thorough water quality assessments in the country. The Assessment includes data from many water bodies across the state, including 9,287 miles of streams, 434 lakes, and 619 square miles of marine water. While this is a vast amount of water and data, the Assessment actually represents only 15% of Washington’s total waterbodies. In other words, this is not a report card for water quality for all of Washington, but instead a snapshot in time of water quality for water where there is data. With a significant increase in available monitoring data, Ecology was able to assess 2,085 water body segments for the first time, adding a wealth of water quality data to the database.
What’s in the data
The Assessment is divided into five categories that describe the status of water quality in a given location, ranging from clean to polluted. Waterbodies are placed in a category by comparing actual data to the state’s water quality standards. Based on the data, high bacteria levels and high water temperatures continue to be the most common pollutants across the state, with low dissolved oxygen and toxic contamination also frequently reported.
The data also tells us that water cleanup efforts are working, as Ecology saw a number of areas where the water moved from being considered impaired to meeting the state’s water quality standards. But there is still work to be done, since many impaired waterways do not currently have improvement plans. See Ecology’s website for information on where the agency has improvement plans in place.
Finding your community’s data and providing feedback
One of the new features of the online Assessment tool is the ability to add a layer of demographic information from the U.S. Census. This means that when looking at water quality data for a specific location or watershed, users can also learn more about the people living in that area. The Census has statistics on language, income, and education for populations in the area, which Ecology and other organizations can use to prioritize work in overburdened communities.
Ecology is holding a virtual training on how to use assessment review tools at 1:30 p.m. April 20. Register for the online webinar.
Ecology is accepting public comment on the draft Assessment until 5 p.m. June 4, 2021. Information on the Assessment and options for commenting are on the Assessment website.
After reviewing public feedback and making any revisions, Ecology will submit the Assessment and related waterbody listings to the U.S. Environmental Protection Agency for approval, as required under the Clean Water Act.


