

Comment on the draft SHARP Tool![]()
We know of about 7,000 contaminated sites in Washington that are being cleaned up or need to be cleaned up. They range from small spills of gasoline to soil to massive sites with multiple chemical contaminants affecting every part of a site. Ranking contaminated sites can help us direct our work and resources.
Since 1992 we’ve used the Washington Ranking Method, or WARM, to rank sites. Over the past few years, we looked at ways to improve our site ranking process and decided it was time to replace WARM. This decision was written into the proposed amendments to Washington’s cleanup regulations, the Model Toxics Control Act (MTCA) Cleanup Rule.
We’ve developed a new site hazard and ranking process that we're calling SHARP. Because site rankings can impact how we prioritize our work, we want people to have a chance to look under the hood and see how the scores are made. You can comment on both the proposed rule and the draft SHARP tool until April 16, 2023.
The new tool
The SHARP tool walks reviewers through SHARP and calculates scores to help us identify sites that pose the greatest chemical exposure risks to people and other livings things.
Benefits of the new tool
An example SHARP report.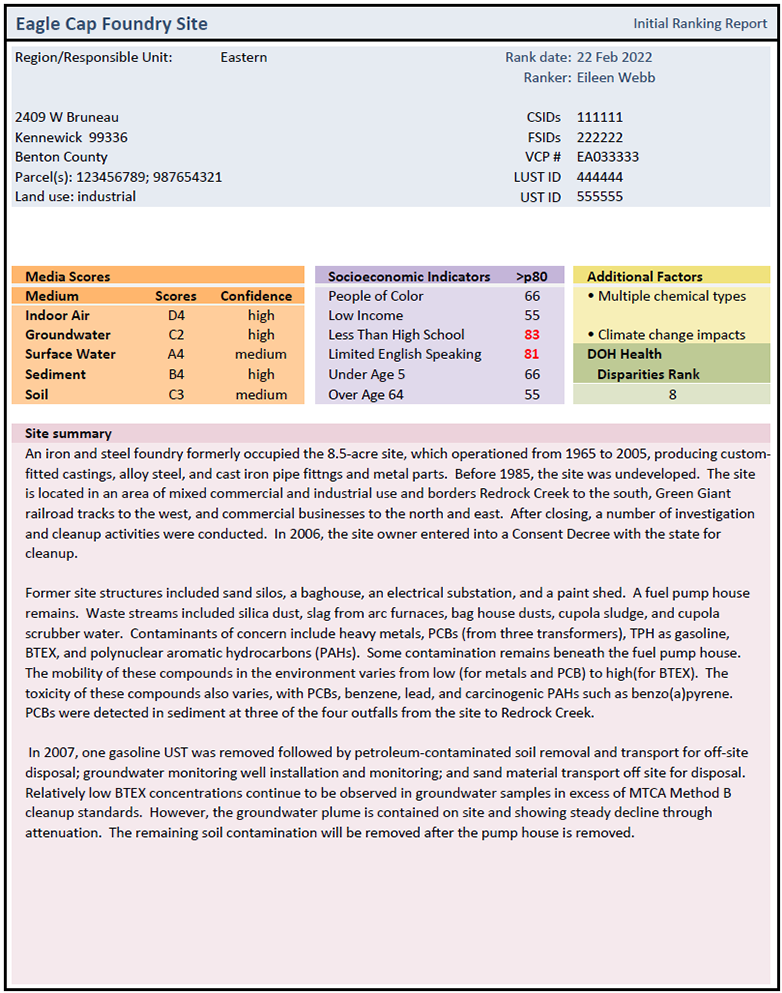
- The SHARP tool is quicker and easier to use than WARM. This should let us rank more sites and re-rank sites as we get new information and as sites get cleaned up. With WARM, we ranked only sites that seemed the riskiest or sites that received public funding.
- WARM rankings take into account air, surface water, and groundwater. SHARP assesses indoor air, surface water, groundwater, sediment, and soil.
- SHARP’s multi-part scores give us more information about what’s going on at a site.
- The SHARP tool includes socioeconomic questions about who lives or works on or near a site. This information can help us work to improve environmental equity.
- SHARP is more flexible, so we can adapt to emerging issues and new science and technology.
What the SHARP scores mean
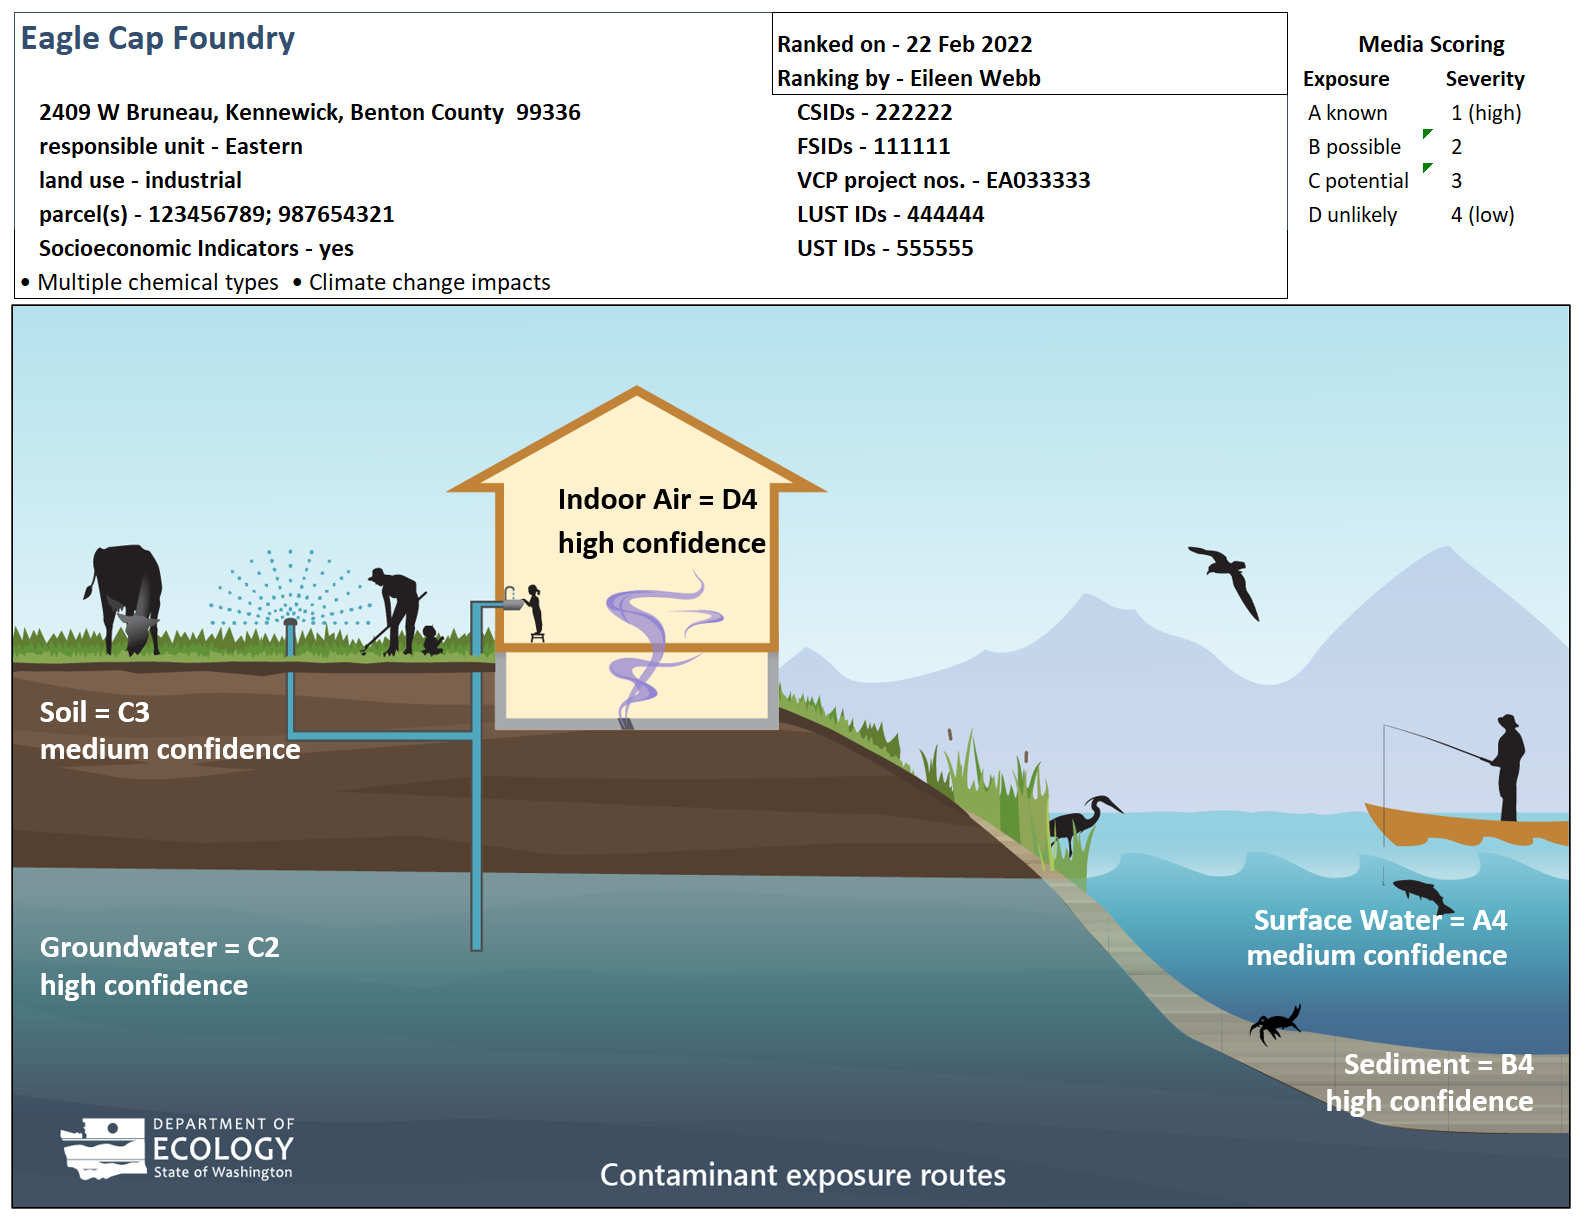
Contamination is risky if a chemical can cause harm and it’s in a place where people or other living things can be exposed to it. The SHARP Tool scores the exposure potential and its severity and creates five two-part scores. It displays these scores and other information in a text-based report and a graphic summary.
Media: where’s the mess?
Wait, five scores? Yes, that’s because the tool calculates separate scores for soil, groundwater, surface water, sediment, and indoor air. Each of these environmental media is a different path by which someone, or some critter, might be exposed to contamination. Tracking them separately gives us the ability to focus on particular issues, like healthy drinking water. It also gives us a better picture of the site.
Exposure
The exposure score answers the question “How likely are people or other living things to be exposed to the contamination at this site?” It’s graded A–D, where A is “there is a known exposure happening right now”, and D is “there’s no likely way for people or other living things to be exposed to this contamination.”
The goal of contamination cleanup is to prevent exposure to contamination. If there’s contamination at a site, but no living thing can reach it or be exposed to it, then the contamination isn’t causing any harm. There are lots of natural examples of this: asbestos, arsenic, and heavy metals are all naturally occurring, and only cause problems when humans or other living things contact them in certain ways.
Severity
The severity score is an estimate of how risky something would be if people or other living things were exposed. It’s estimated on a scale of 1 to 4, where 1 is the most severe and 4 is the least.
More than just numbers
These five scores give us a picture of what and where contamination is at a site, but they’re not the only info reported in SHARP.
- Rating how much we know
Often, our initial information about a site is very limited. For instance, we might know a chemical barrel spilled on soil, but not what the chemical was. Using SHARP, we can identify sites where we need more information. This confidence score is included on the SHARP report. - Looking at the bigger picture
SHARP is focused on exposure and severity, but it’s also important to know about issues that don’t fit neatly into either box. For instance, a site might be in a neighborhood that already has other pollution problems, or it might be vulnerable to rising sea levels or flooding. The SHARP reports include community demographics, existing pollution issues, and other information about the context of the contaminated site. This can help our efforts towards environmental justice and climate change resilience.
Take the SHARP tool for a test drive!
During this comment period, we’d like you to download the SHARP tool and the SHARP tool manual, and take a peek. The draft SHARP tool is in Microsoft Excel format, so you can see all the nuts and bolts of how calculations are made (warning: you’ll need that high-school algebra you thought you’d never use).
For this comment period, any comments should be about the SHARP tool itself and how well it works, not about how the results will be used. Think of it like looking under the hood and kicking tires before starting a road trip. After this public comment period, we’ll develop policy and internal guidance as separate steps.
So download the files, grab the keys, and take the SHARP tool for a test drive. If the algebra is too much — we’re not all toxicologists — you can still take a look at the reports to see how the "final product" of an assessment might look.
Then tell us what you think!
What happens next?
We’ll review your feedback, and then finalize how the SHARP tool works. Then we’ll convert it into a software application. We’ll also work on combining the five scores — for soil, groundwater, surface water, sediment, and indoor air — into one overall site score, so we can provide a quick estimate of a site’s comparative risk. Over time, we’ll integrate the application with our other data tools, like Cleanup and Tank Search, so you’ll be able to see SHARP scores as we update them.
The current cleanup regulations require we use the outdated WARM. We won’t start publishing SHARP results until an amended version of the rule is adopted, but we’ll be busy at work in the background.