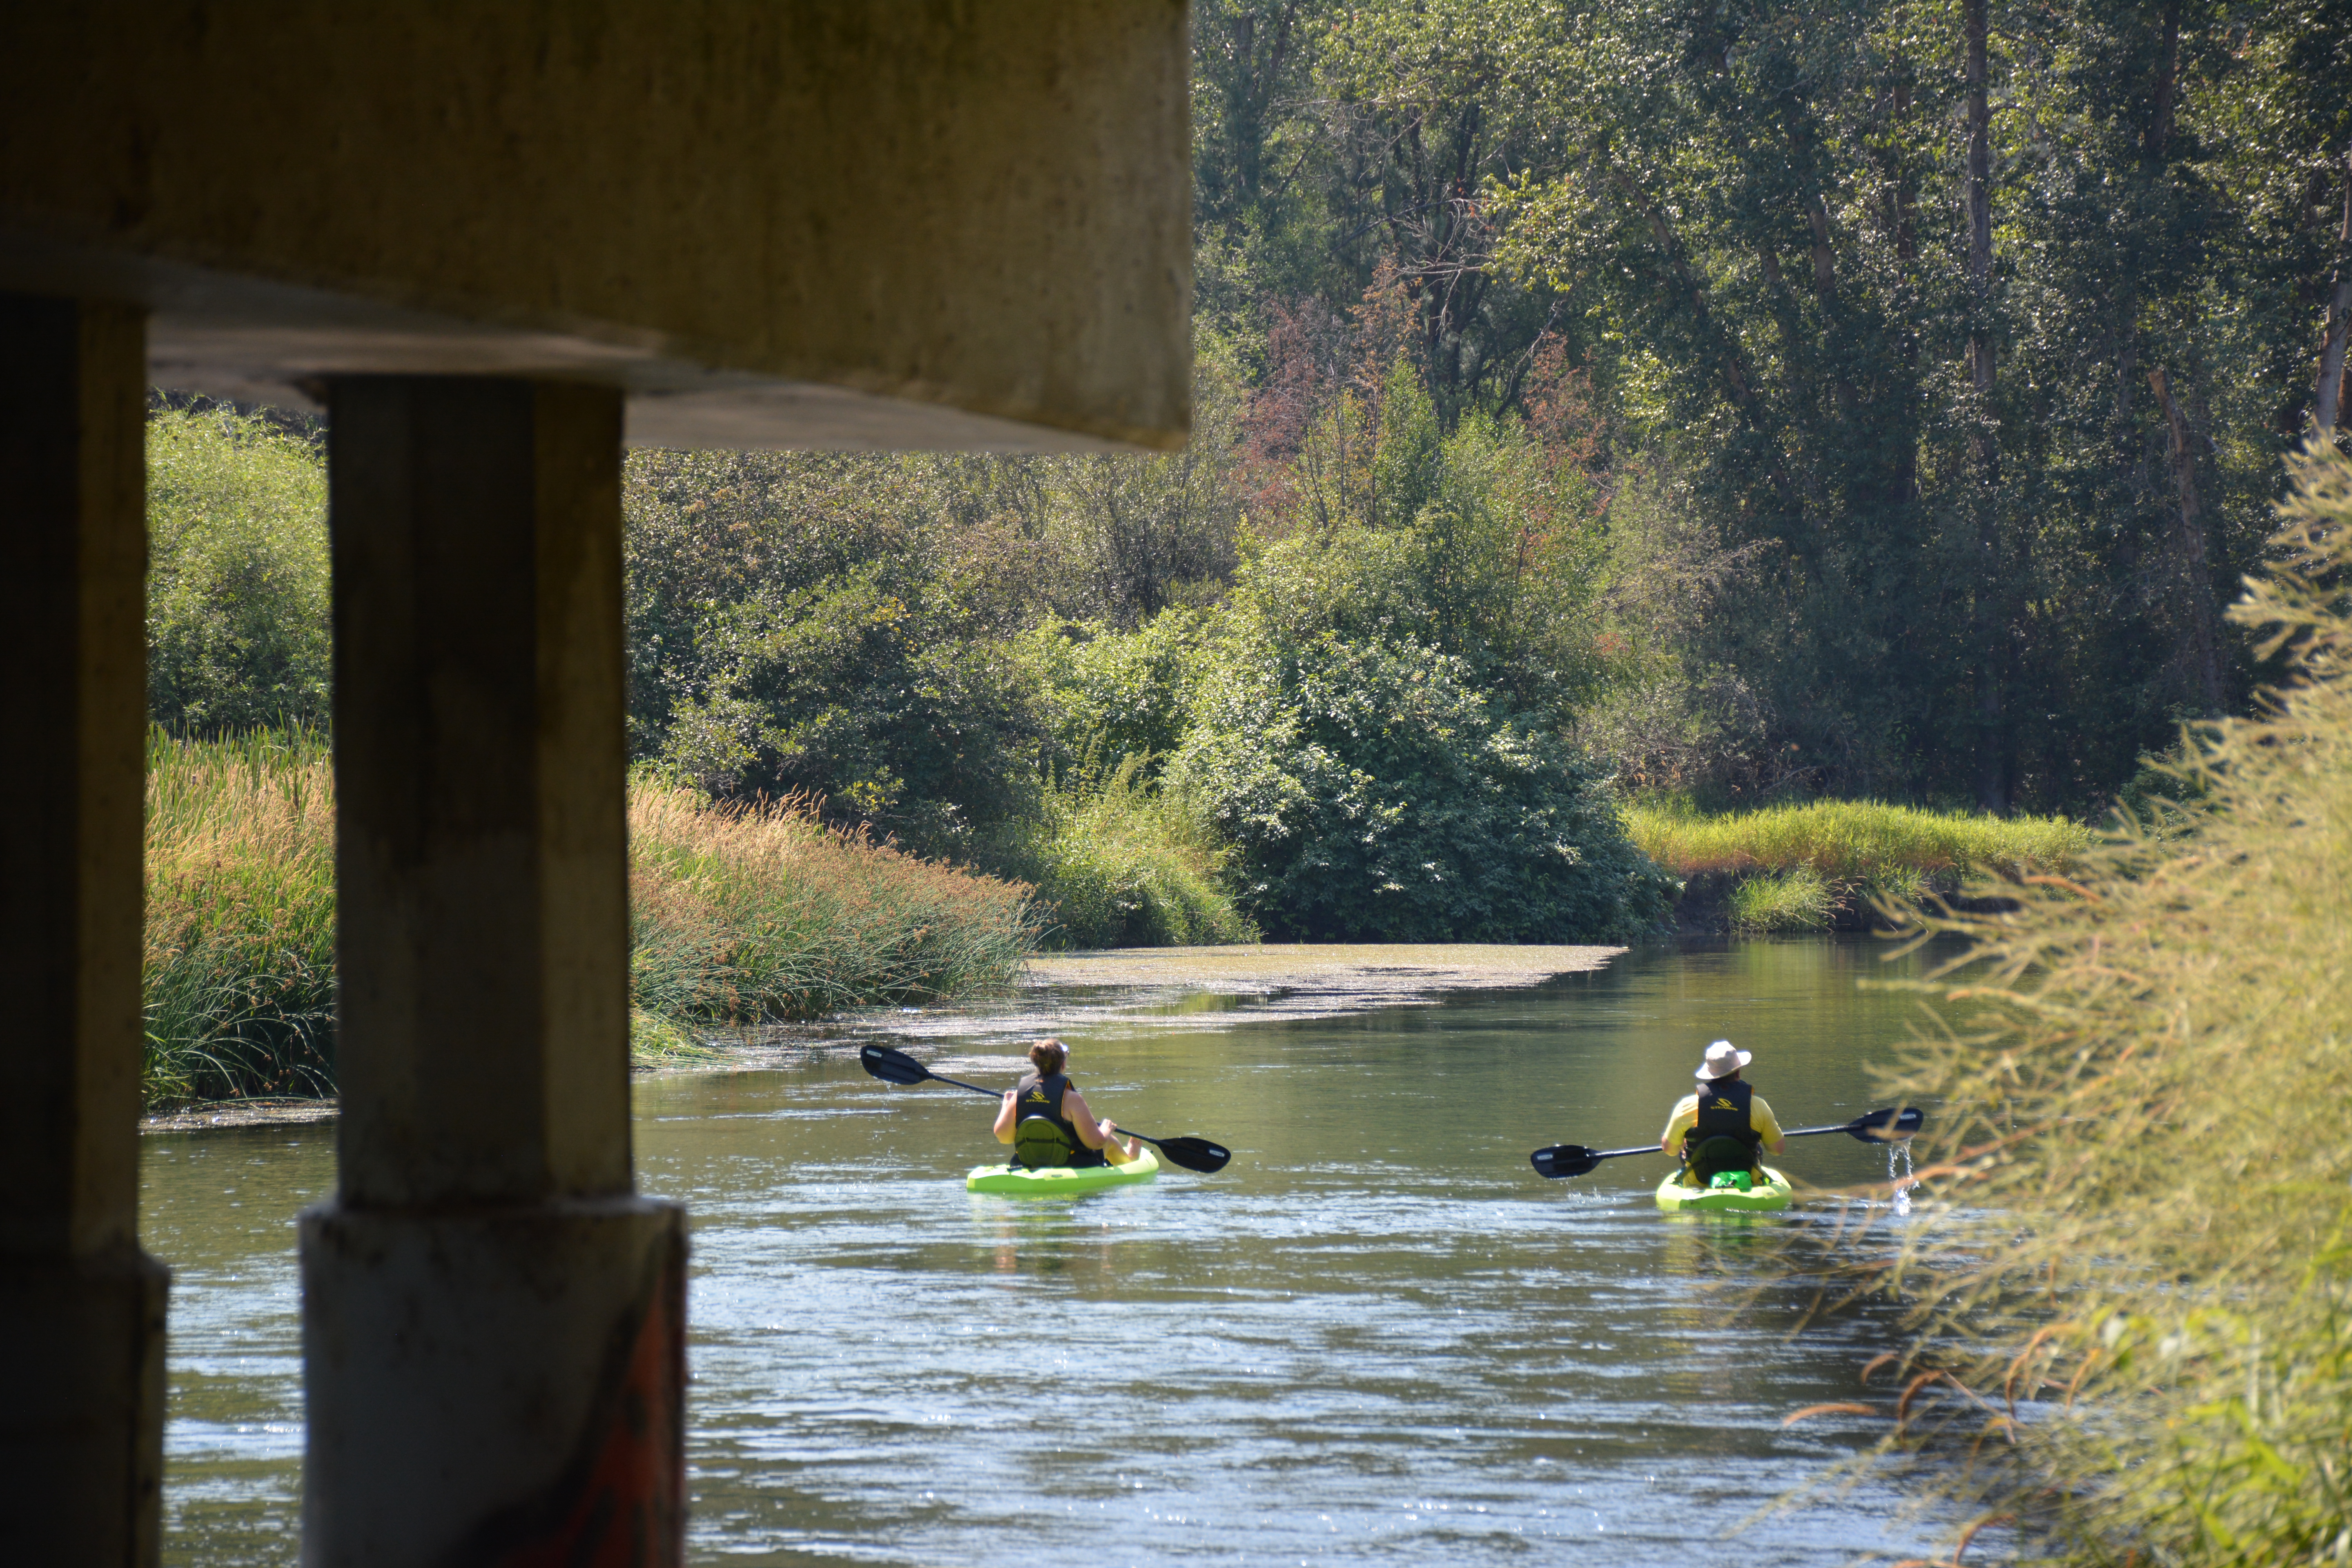
People kayaking in the Little Spokane River where a water clean up plan is in place.
Washington is a water state, and all of that water provides a lot of data. We use the data we have on our state’s rivers, streams, lakes, and marine waters in many ways. Data helps us prioritize water clean up efforts and project funding, update permit requirements, understand the effectiveness of restoration and pollution prevention actions, and it can help communities better understand the water that surrounds them.
One of our state’s most significant water-related data efforts is the Water Quality Assessment. The Assessment is an interactive online tool that pulls together existing data for fresh and marine waters as a resource for Tribal, federal, state, and local governments, universities, and other organizations. This data helps these groups design monitoring programs, water quality improvement projects, and to share successes in these efforts.
What is the Water Quality Assessment?
The federal Clean Water Act requires states to perform a Water Quality Assessment every two years to track how clean the rivers, lakes, and marine water bodies are. We place assessed water bodies in categories that describe the quality of the water and status of any needed cleanup. The Assessment helps us use state resources more efficiently by focusing our limited resources on water bodies that need the most work. The Assessment houses the Clean Water Act required 303(d) list of impaired waters.
We are working on the latest Water Quality Assessment for Washington. This Assessment is referred to as the 2022 Assessment, because it picks up where the last Assessment left off (the 2018 Assessment was submitted to EPA in 2021).
You can view the draft results of the Assessment in our online search tool or our mapping tool, the Water Quality Atlas.
What does the data tell us?
For this Assessment, we evaluated over 85 million data points from many water bodies across the state, including 9,322 miles of streams, 449 lakes, and 633 square miles of marine water. While this is a vast amount of water and data, the draft Assessment represents only a portion of Washington’s total waterbodies. For example, we have data for:
- 17% of marine waters
- 11% of lakes
- 88% of the Columbia and Snake rivers
- 4% of all other rivers and streams
The most common water pollution problems continue to be elevated water temperatures and high bacteria levels, which combined make up nearly half of the total polluted water. The other common pollution problems are low dissolved oxygen and toxics (this includes many individual toxic chemicals).
The draft Assessment also shows how site-specific efforts to improve water quality are working. More than 100 listings that were previously considered polluted are now considered clean or meeting water quality standards.
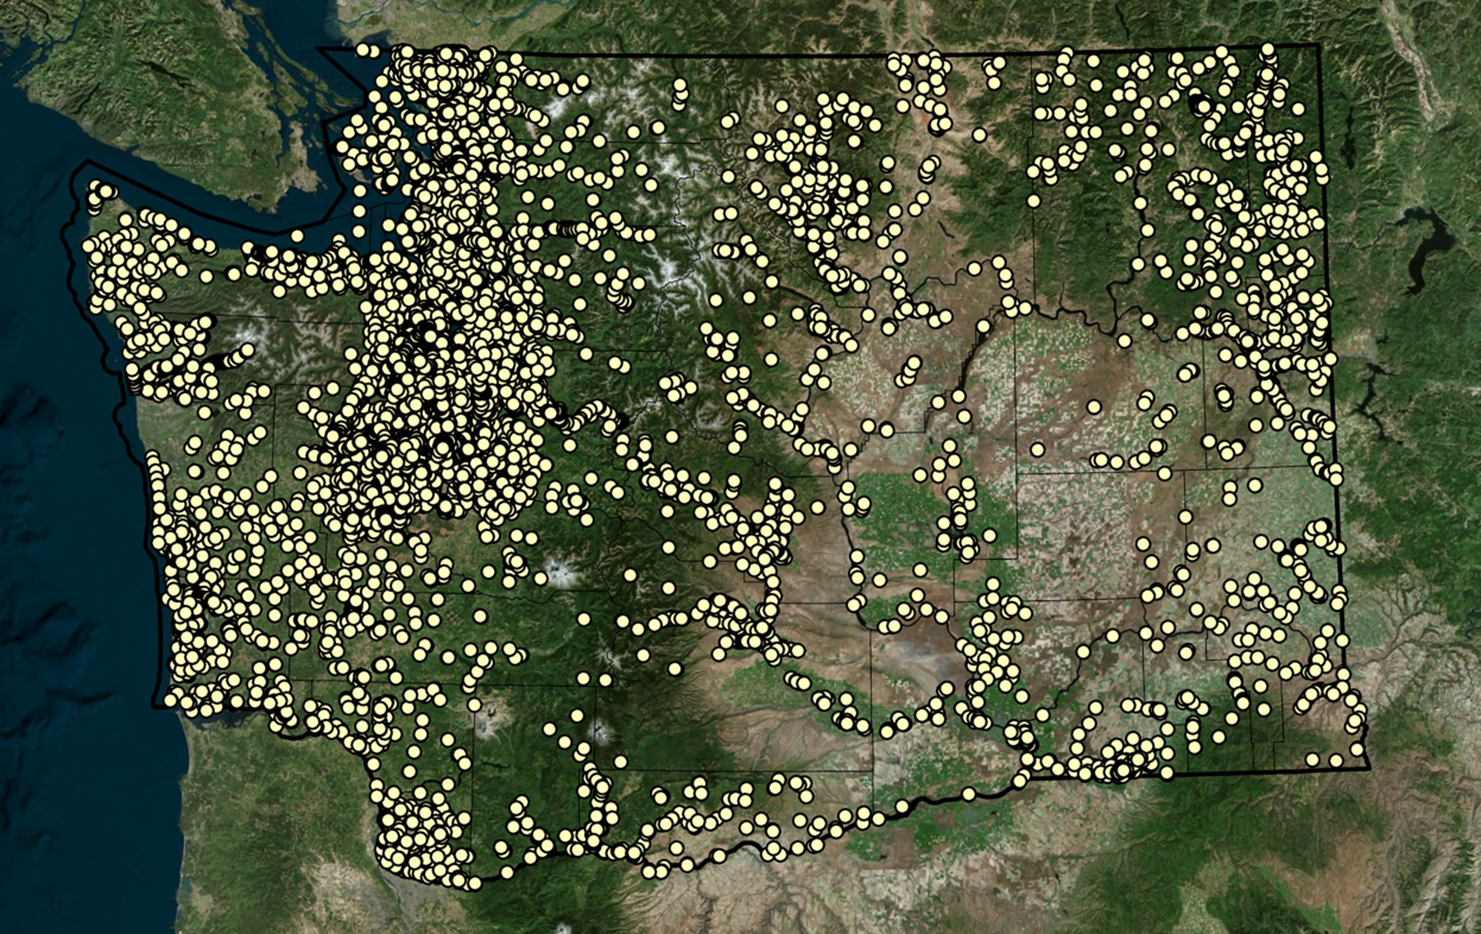
There are more than 15,000 locations in Washington with water quality data.
A closer look at harmful algae blooms
New to the Assessment this year is the use of a harmful algae blooms (HABs) methodology to evaluate HABs impact on contact recreation. Based on the data we evaluated, we have listed 40 lakes as impaired for harmful algae blooms. This means harmful algae blooms are preventing safe recreation during at least a portion of the year in 40 lakes across the state. Much of this data came from lakes where there are focused efforts to gather data on blooms. Harmful algae blooms can lead the closure of lakes and portions of rivers for recreation like swimming. This is because the toxins in an algae bloom can cause illnesses and rashes in humans, pets, and wildlife. In recent years, there have been pet deaths linked to exposure to toxic algae blooms.
What causes these blooms? It is often directly connected to past or current pollution, such as excess nutrients going into a lake. This could be from fertilizers, leaking septic systems, or pet waste, for example. Every lake is unique in what is causing these toxic blooms. By having this information in the Assessment, we will be able to better support communities looking to improve the health of their local waterbodies.
Learn more about harmful algae blooms in our blog post, which includes helpful tips and resources available to report blooms. By following best management practices, individuals and organizations can help keep Washington's waters healthy.
Where does the data come from?
We use data gathered by Ecology and readily available data from local, state, and federal agencies, Tribes, and environmental groups. To help ensure that the data we use is accurate, all data must meet our credible data requirements.
Many of the state's more polluted water bodies are where monitoring is focused. Our work and the work of our clean water partners prioritzes areas where human activity could be impacting water quality. This helps us measure how water quality improvement efforts are working. We have minimal data in the Assessment for Washington’s more pristine, and often remote, waterbodies.
Review the results and learn more
We are accepting feedback on the draft Assessment from Nov. 4, 2024, to Jan. 10, 2025. Want to learn more? We are holding a virtual public workshop on Nov. 13, 2024. We will give a presentation on the Assessment and how to submit comments, followed by a question and answer session.
Register on Zoom – Nov. 13, 2024 at 2 p.m.
If you have questions about the Assessment, please email 303d@ecy.wa.gov
After reviewing feedback, we will update the Assessment and submit it to EPA for approval.
We will begin collecting data for the next Assessment in the spring of 2025. The next Assessment will analyze water quality data collected from 2015 through 2024. We expect the next draft Assessment will be available for public review in 2027.

