

Improving air quality in overburdened communities
Important information
- Read what's new in the 2025 two-year report.
- Your opinion matters. Take our air quality survey: Español | 中文 | Tiếng Việt | 한국어
We're working to improve air quality in 16 Washington communities and participating Tribes that are historically overburdened with health, social, and environmental inequities and are highly impacted by criteria air pollution, such as ozone and fine particles. A section of the Climate Commitment Act directs this work.
2025 report about overburdened communities
The 2025 report shares new data about the impacts of air pollution as well as signs of progress. Within the 16 overburdened communities:
- An estimated 430 adult deaths (ages 18-84) were associated with fine particle (PM2.5) exposure. Seasonal ozone exposure contributed to about 35 deaths per year from various causes.
- From 2022–2024, people in overburdened communities experienced 2.9 days per year with air quality considered "unhealthy for sensitive groups" or worse. This is down from 7.5 days per year between 2020–2022. Most of these unhealthy days were linked to wildfire smoke events.
- From 2020–2023, greenhouse gas emissions from facilities covered by Washington's cap-and-invest program decreased by 20%.

Learn more about climate action in Washington.
Air quality community grant program
Projects are underway for a new grant program to reduce criteria air pollution in these overburdened communities and participating Tribal communities. Grant funding supports participating Tribes and local organizations to develop and implement community-led projects to improve air quality and protect people's health.
These grants are paid for by funds from the Climate Commitment Act. The Climate Commitment Act supports Washington's climate action efforts by putting cap-and-invest dollars to work reducing climate pollution, creating jobs, and improving public health.
Communities identified as overburdened
We have already identified 16 areas in Washington that are overburdened and highly impacted by criteria air pollution. The places are a mix of urban, suburban, and rural. They vary in population, from about 1,500 to more than 200,000 people. They also range in area, from less than three square miles to 173 square miles. Together, they represent more than 1.2 million people or about 15.5% of Washington’s population.
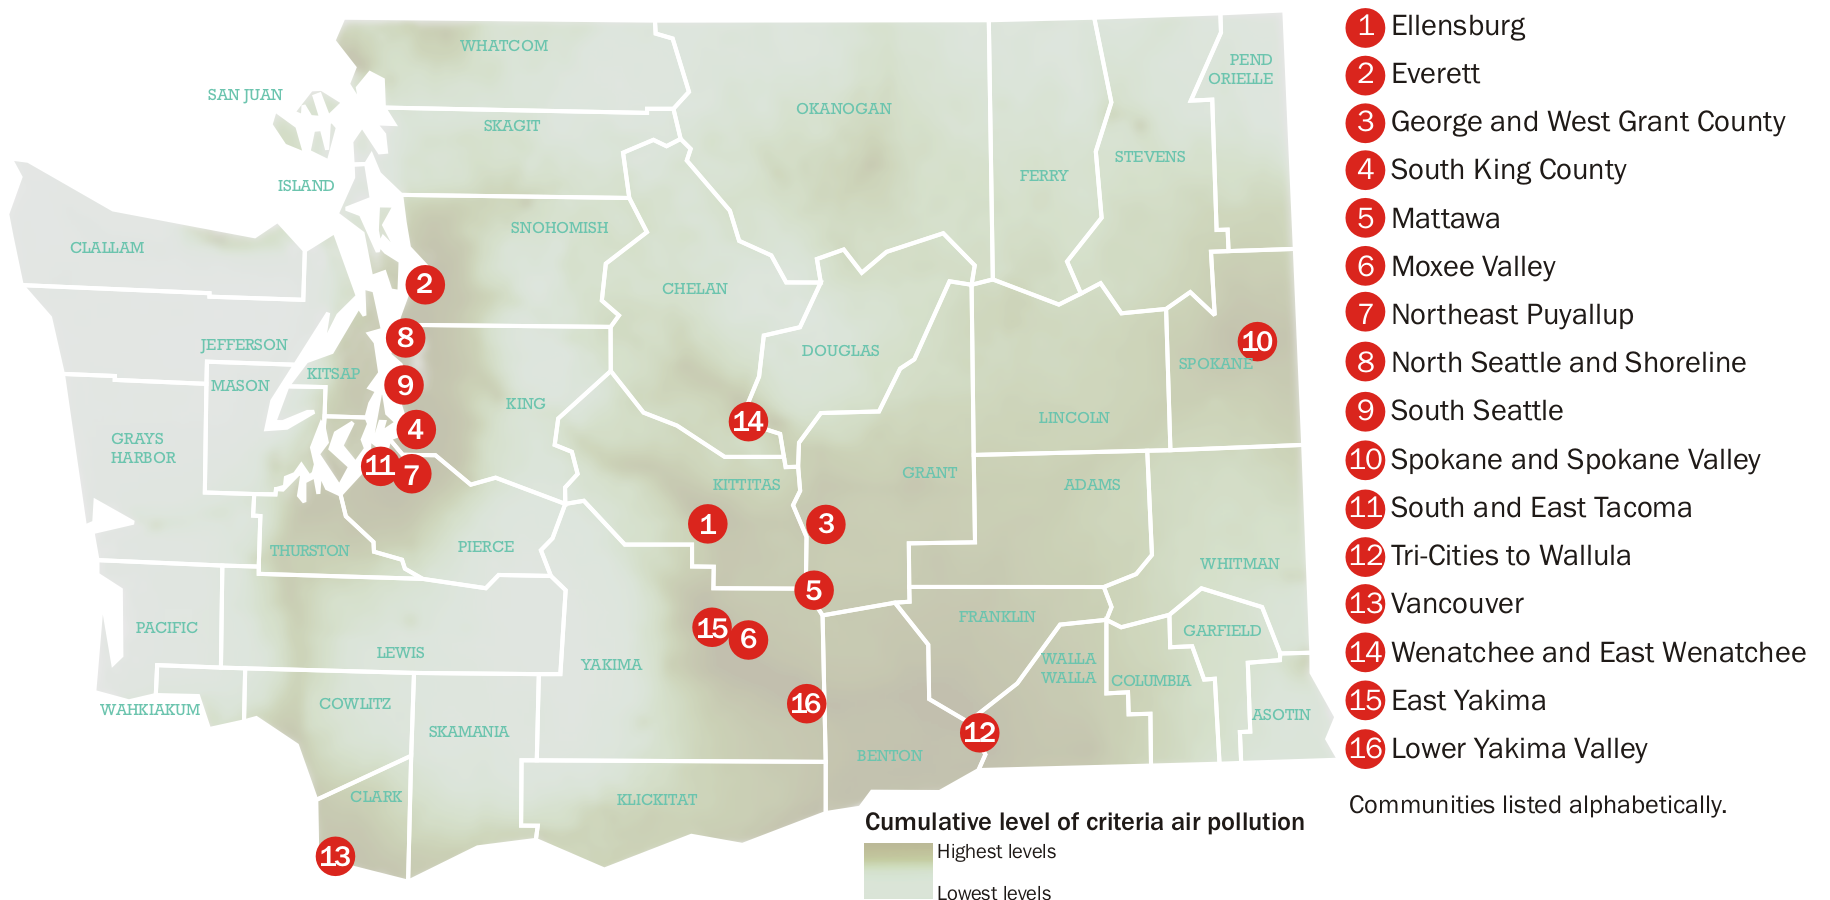
This list is intended for the purposes outlined in the environmental justice review section of the Climate Commitment Act.
Community information
Each community listed in the table is linked to more information, specific boundaries, and the process we used to identify them. Click any column header in the table to sort the information.
| Area 1 | Estimated Population | Size (approximate square miles) | Elevated Air Pollutants |
|---|---|---|---|
| Ellensburg | 17,751 | 6 | Fine particles (PM2.5), cumulative criteria air pollution |
| Everett | 87,620 | 17 | Fine particles (PM2.5) |
| George and West Grant County | 3,392 | 118 | Fine particles (PM2.5) |
| King County, South | 211,445 | 68 | Fine particles (PM2.5), cumulative criteria air pollution |
| Mattawa | 5,412 | 12 | Fine particles (PM2.5) |
| Moxee Valley | 9,556 | 38 | Fine particles (PM2.5), cumulative criteria air pollution |
| Puyallup, Northeast | 9,621 | 3 | Cumulative criteria air pollution |
| Seattle, North and Shoreline | 41,628 | 5 | Fine particles (PM2.5), cumulative criteria air pollution |
| Seattle, South | 207,863 | 44 | Fine particles (PM2.5), cumulative criteria air pollution |
| Spokane and Spokane Valley | 150,692 | 42 | Fine particles (PM2.5), cumulative criteria air pollution |
| Tacoma, South and East | 144,325 | 28 | Fine particles (PM2.5), cumulative criteria air pollution |
| Tri-Cities to Wallula | 114,203 | 173 | Particle pollution (PM2.5 and PM10), ozone, cumulative criteria air pollution |
| Vancouver | 109,146 | 29 | Fine particles (PM2.5), cumulative criteria air pollution |
| Wenatchee and East Wenatchee | 32,495 | 10 | Fine particles (PM2.5) |
| Yakima, East | 59,938 | 16 | Fine particles (PM2.5), cumulative criteria air pollution |
| Yakima Valley, Lower | 56,628 | 157 | Fine particles (PM2.5), cumulative criteria air pollution |
1 All areas ranked high on the Washington Environmental Health Disparities map and/or EPA's EJScreen mapping tool. These tools show where vulnerable populations face more risk or exposure to pollution. We also looked at other factors: social and economic differences, historic redlining, health care access, known health disparities (such as increased asthma and lower life expectancy).
Background documents
- Focus on: Improving Air Quality in Overburdened Communities, Nov. 2024
- Focus on: Air Quality Environmental Justice Report, April 2024
- Focus on: Improving Air Quality in Overburdened Communities, Sept. 2023
- Improving Air Quality in Overburdened Communities Highly Impacted by Air Pollution: 2023 Report
- Community Summary Report, March 2023
- Technical Support Document, Feb. 2023
- Response to Comments, March 2023
- Policy Statement: Identification of Overburdened Communities Highly Impacted by Air Pollution, March 2023
- Focus on: Our Plans to Improve Air Quality in Overburdened Communities, Sept. 2022
- Focus on: Improving Air Quality in Overburdened Communities Initiative, June 2022
Next steps
Reducing criteria air pollution in identified communities will happen in stages over multiple years. Next steps include:
- Continue to expand Washington's air monitoring network in the 16 communities.
- Continue to ask for community input, including about the new grants program.
- Work with Tribal governments that may be interested in participating in this work.
- Collect and analyze data about criteria air pollutants affecting these communities.
- Continue rulemaking for more protective air quality standards in the 16 communities.
- Track and report every two years about criteria air pollution, greenhouse gas emissions, and health impacts in each community.
- Re-evaluate the list of communities every six years.
Related links
Contact information
Taylor Van Cise
Communications Manager
taylor.vancise@ecy.wa.gov
360-688-8070
Stay informed
Join our email list