

Data collection methods
Our scientists use different techniques to monitor Washington's marine beaches and bluffs. We measure the elevation and shape of coastal topography to understand how quickly bluffs may erode or where beaches might be vulnerable to waves and flooding. We also map the depth and shape of the sea floor to see how sand moves around offshore and to learn about nearshore habitats. All these changes influence the amount of available wave energy that can impact the shoreline and cause beach, dune and bluff erosion.
Our ability to seamlessly capture coverage of bluffs, beach face, and adjacent sea floor is incredibly valuable in helping us understand the nearshore zone, where most changes in morphology occur and valuable ecosystem services exist.
Since it is difficult to collect data within the intertidal and shallow sub-tidal zones, we use a combination of various coastal zone mapping techniques to overcome this challenge.
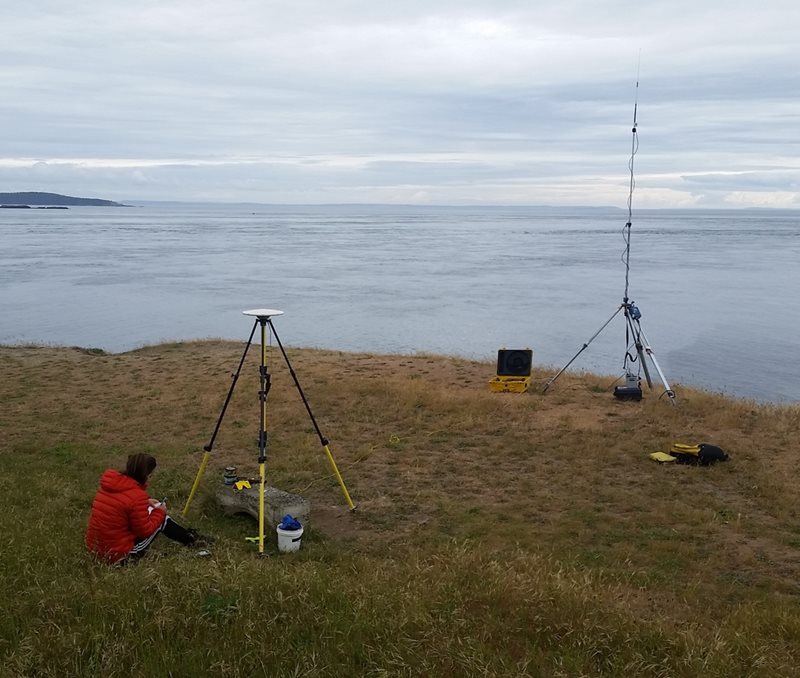
All of our data is collected using global navigation satellite systems (GNSS). We use a local GNSS base station setup on a known location to transmit real-time corrections for its position.
Radio transmission sends the data to other GNSS receivers mounted to backpacks, an all-terrain vehicle (ATV), or our boat.
This technique, called Real-time Kinematic (RTK) GNSS, achieves accurate position data within an area about the size of a golf ball (2-4 cm).
Efficiently collecting data
To cover a large region efficiently, we often collect profiles of beaches and nearshore areas to capture a two-dimensional, cross-section of the coast. Then surveyors can walk the beach portion using a global navigation satellite system (GNSS) mounted on a backpack.
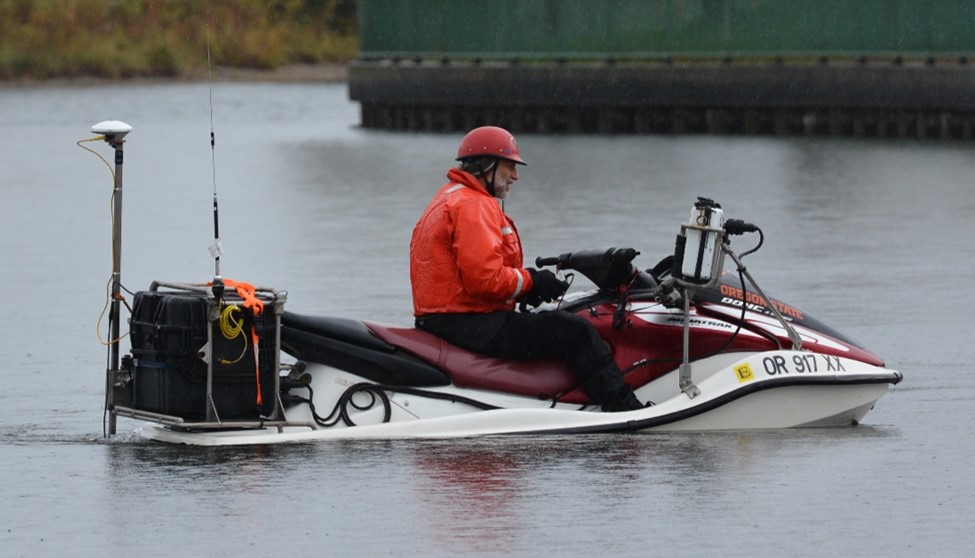
We use personal watercraft with a single-beam sonar and GNSS to collect information about the nearshore portion. These small, maneuverable vessels allow us to collect data through the surf zone and in shallow waters.
These cross-shore profiles help provide important information about a beach such as:
- Dune elevation
- Beach slope and width
- Presence of sand bars
When we collect the same beach and nearshore profile multiple times, we can better assess how the beach is changing.
If we need a more detailed, high-resolution three-dimensional model of a coastline, we use equipment on our research vessel to collect data to create a digital elevation model. Our boat is equipped with a laser scanner (lidar) which scans the vertical bluffs onshore, and multi-beam echo sounders (sonar) to measure the depth of the sea floor beneath the boat.
We conduct lidar scans at low tide and multibeam surveys at high tide so there is an overlap between our data collection methods. Any gaps or shadows in the data are filled in by ground-based GNSS surveys at low tide.

Beach topography
Beach profiles
Beach profiles are normally surveyed at low tide to measure the elevation of the subaerial beach (the part of the beach uncovered by water) as far into the intertidal zone as possible. A GNSS antenna attached to the backpack collects elevation data one point per second wherever the surveyor walks. Beach profiles are collected by walking along pre-defined transects starting in the dunes and walking across the shore to approximately waist deep in water. By walking the same profiles each season, we can measure how the beach face is changing over time.
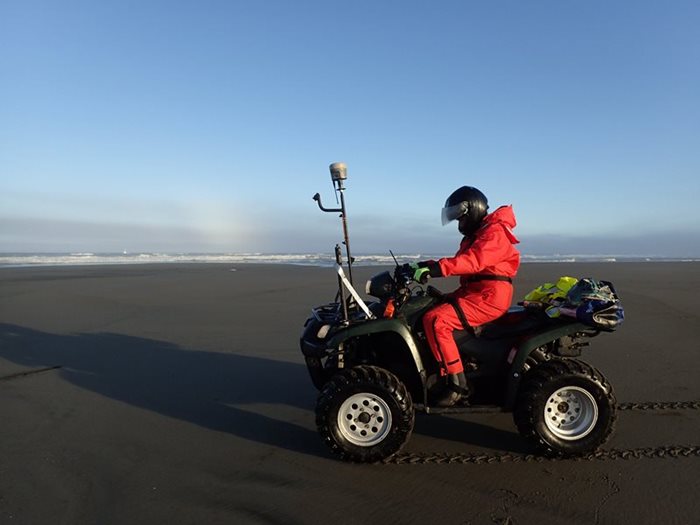
Surface maps
In order to map how beach features differ and change alongshore, we attach a GNSS antenna to an ATV and drive it back and forth along the beach. Data points are collected every 1-m, creating a 3D map of the beach surface. In one low tide, a surface map can be driven for a 4-km (2.5-mi) section of beach. These maps can be used for volume change analysis to determine how much sand is moving over time.
Boat-based lidar
Lidar (light detection and ranging) is a technology that uses beams of invisible light to scan objects and landscapes, measuring their distances, reflectivity, and 3D shapes. A laser scanner can be mounted to a number of platforms such as a tripod, plane, car, or boat, depending on the feature to be scanned. We collect lidar with a laser scanner mounted to the top of our boat, the R/V George Davidson. From this position, it can scan bluffs and beaches as we navigate along the shoreline. The data collected by the laser scanner is much denser than could be collected by GNSS on foot, with dozens of points per square meter.
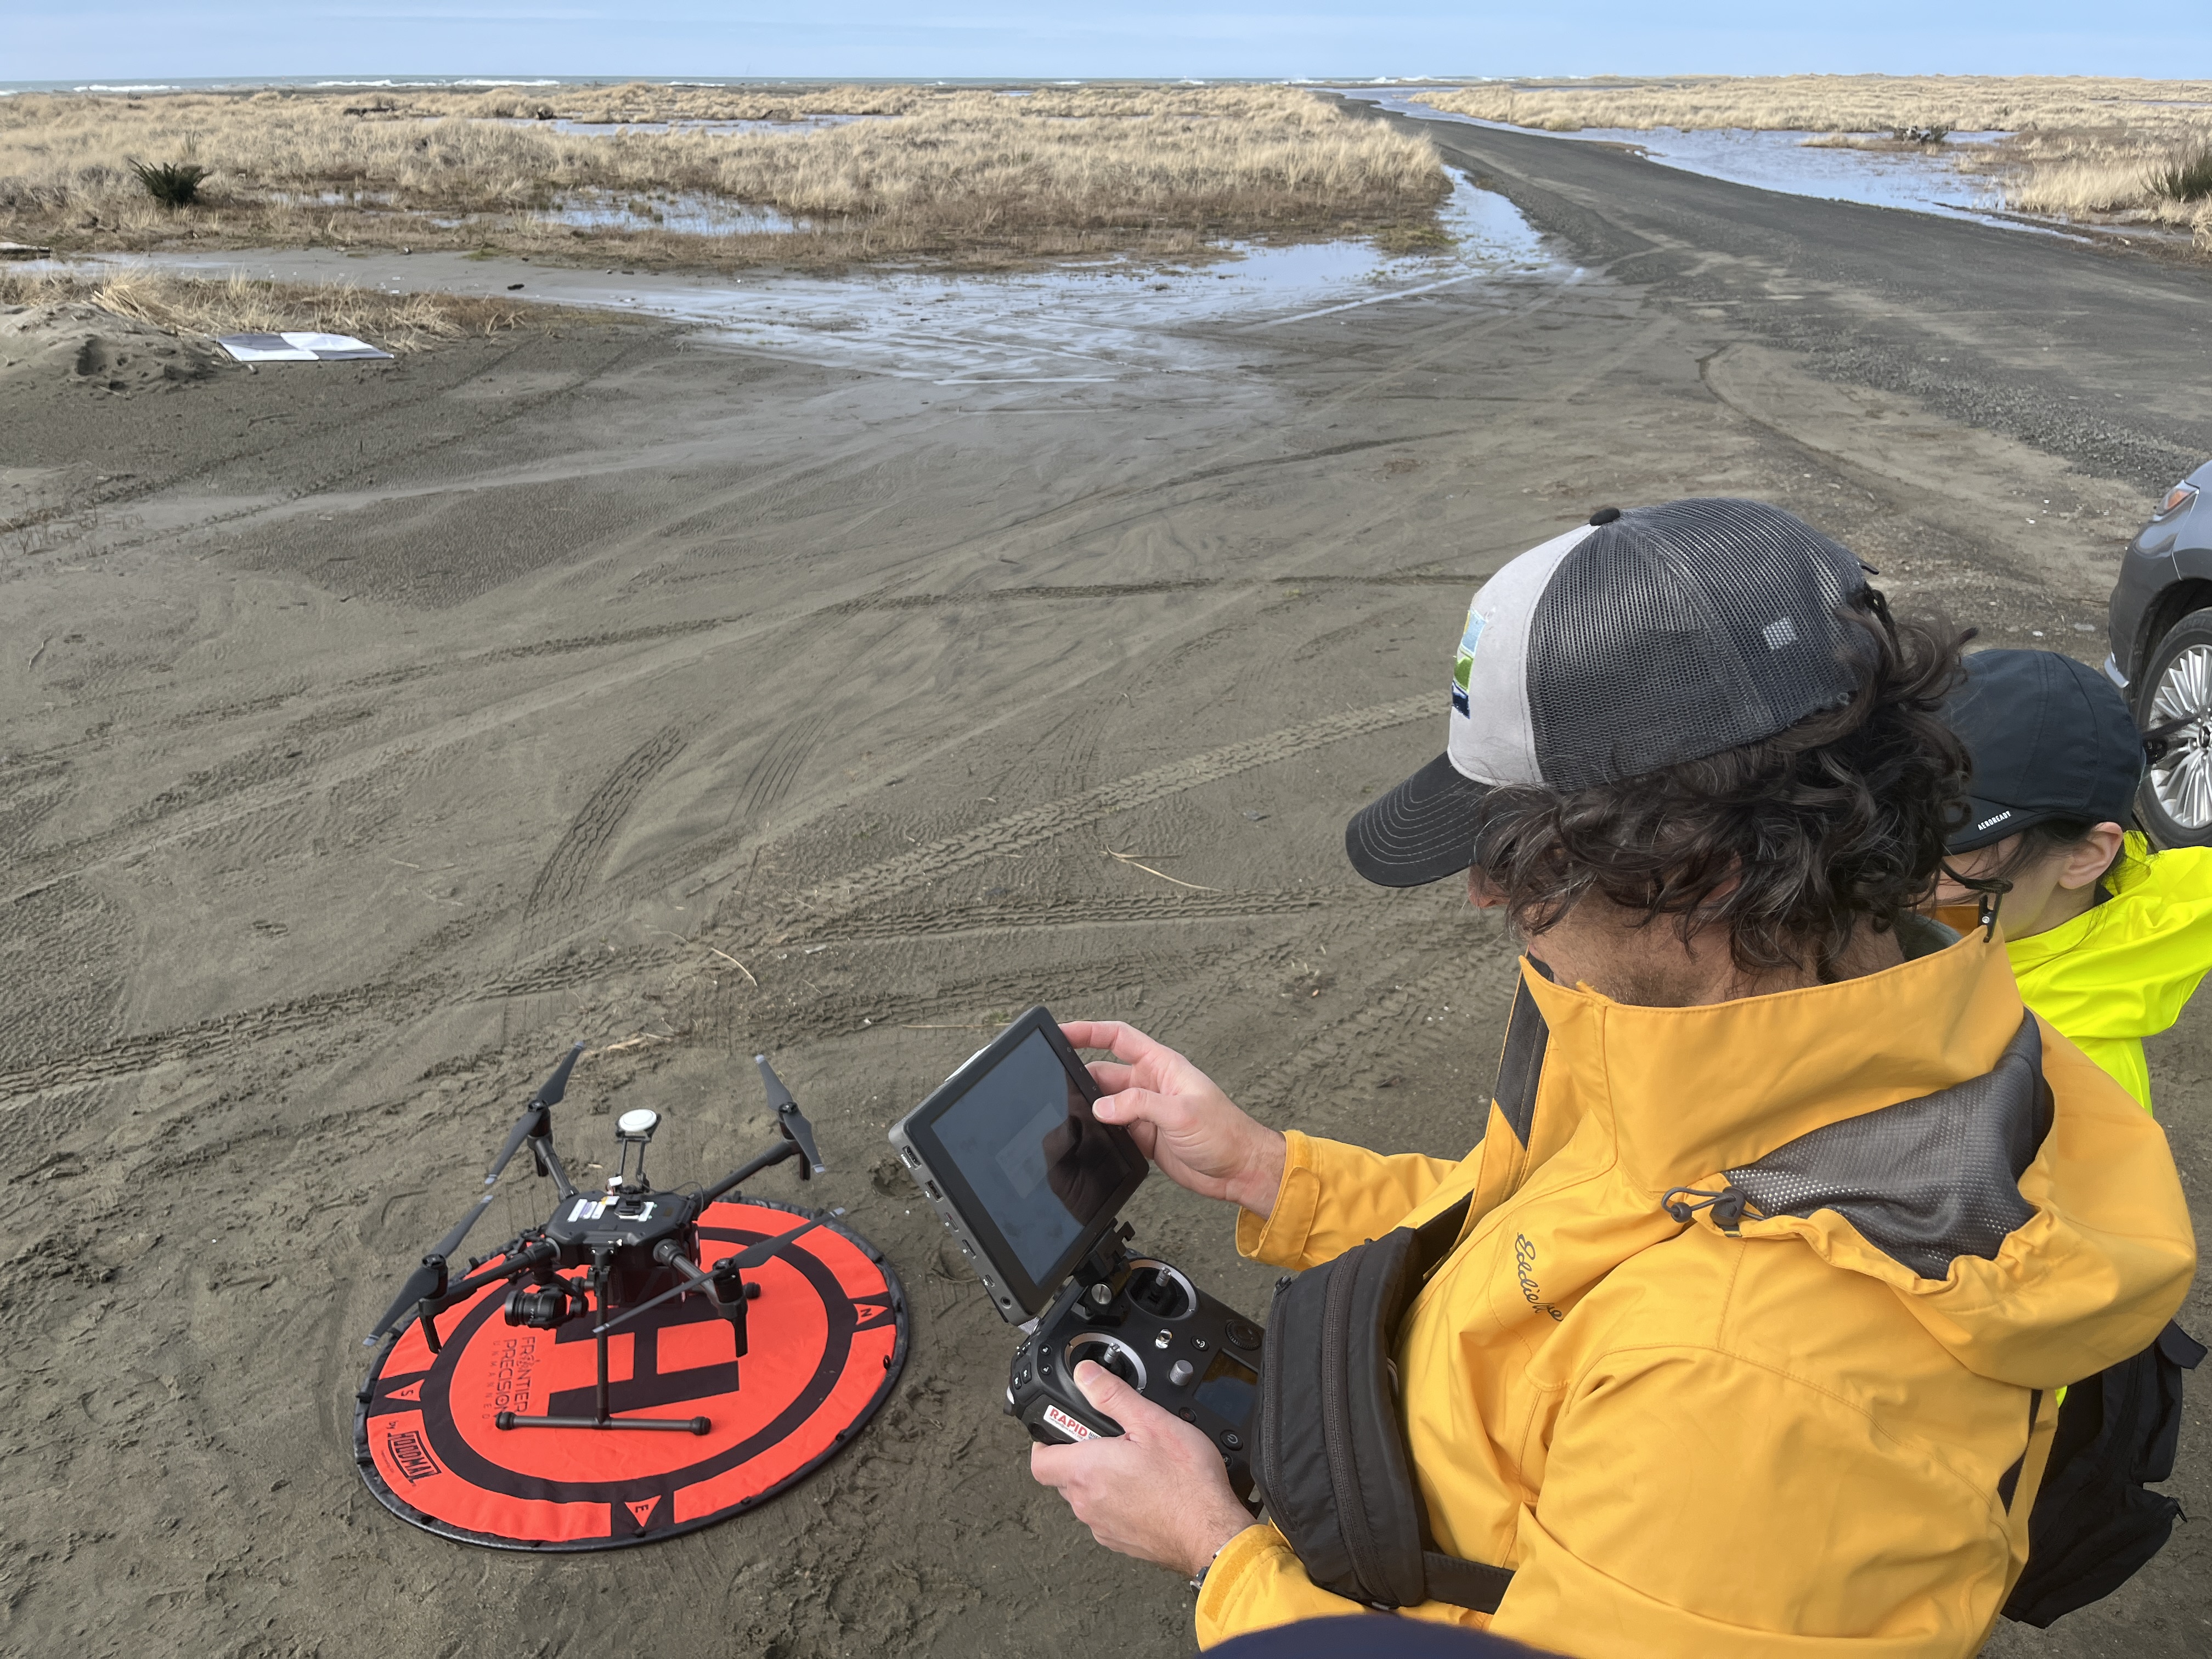
Mapping using unmanned aerial systems
Unmanned aerial systems, commonly called drones, are equipped with lidar and photogrammetry sensors. Drones give us the ability to collect high-resolution topography and aerial shoreline images in a more efficient way than traditional ground-based surveys. We can capture a more complete snapshot of a beach and reduce the risk of injuries our surveyors can face when collecting data over unstable, slippery rocks or along steep dune scarps.
Nearshore bathymetry
Single beam sonar
At high tide, when the lower beach face is submerged, personal watercraft (PWC) are used to collect seafloor depths along the same transect walked by surveyors on the beach during low tide to continue the 2D profile offshore. The depths are measured using a single beam echosounder (sonar) that sends a ping of sound down to the seafloor and calculates a depth based on the length of time it took for the sound to return the sonar. The PWC can also be used in rivers or lakes that are too shallow for a larger boat to safely navigate.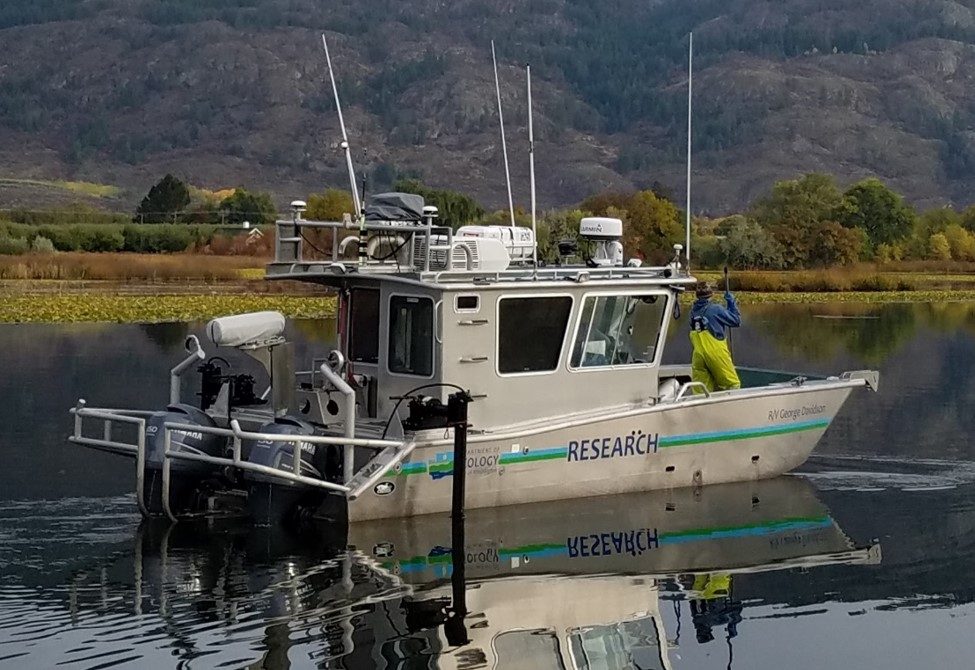
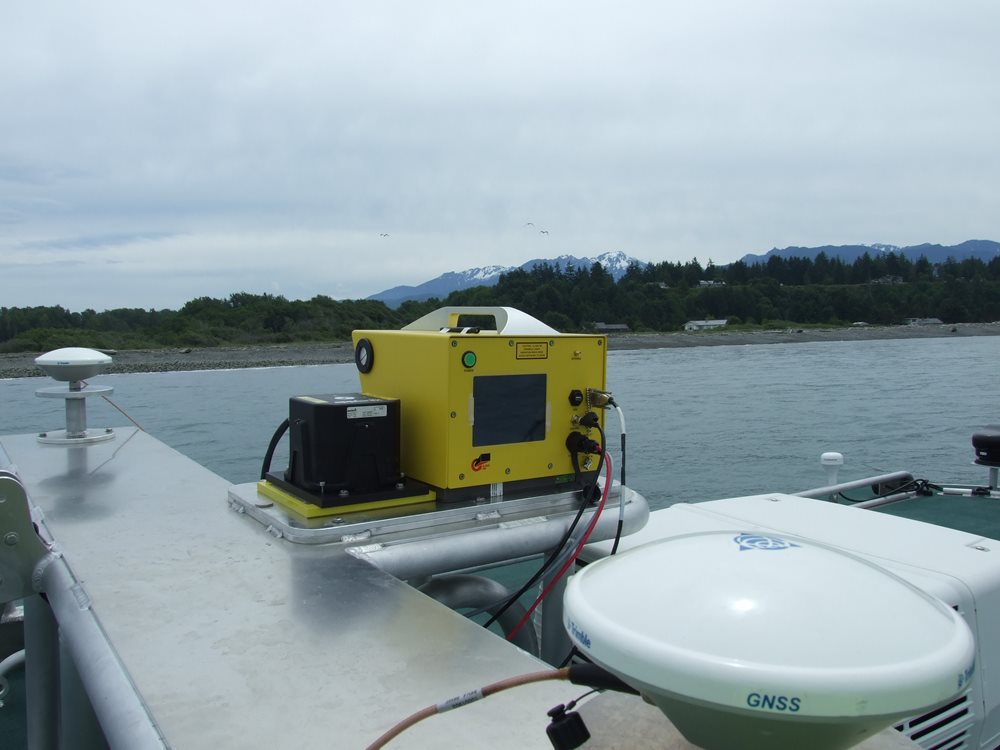
Multibeam sonar
A multibeam sonar is similar to a single beam sonar in that it emits pulses of sound through the water column that bounce off the seafloor and return to the sonar to measure the depth. Instead of having only one beam, though, our multibeam has 256 beams that fan out in a swath to map four times the water depth at once. This means that in four meters of water, we can map a width of 16 meters of seafloor in one pass. CMAP's research vessel, the R/V George Davidson, has a dual-mount, dual-head multibeam sonar system to deploy two multibeam sonars at once, one off each side of our boat. This helps us to more efficiently map very shallow water as close to the shoreline as possible (up to ~1 m depth). For more information about our vessel setup, read this article in xyHt magazine, titled "Dual-head Mapping".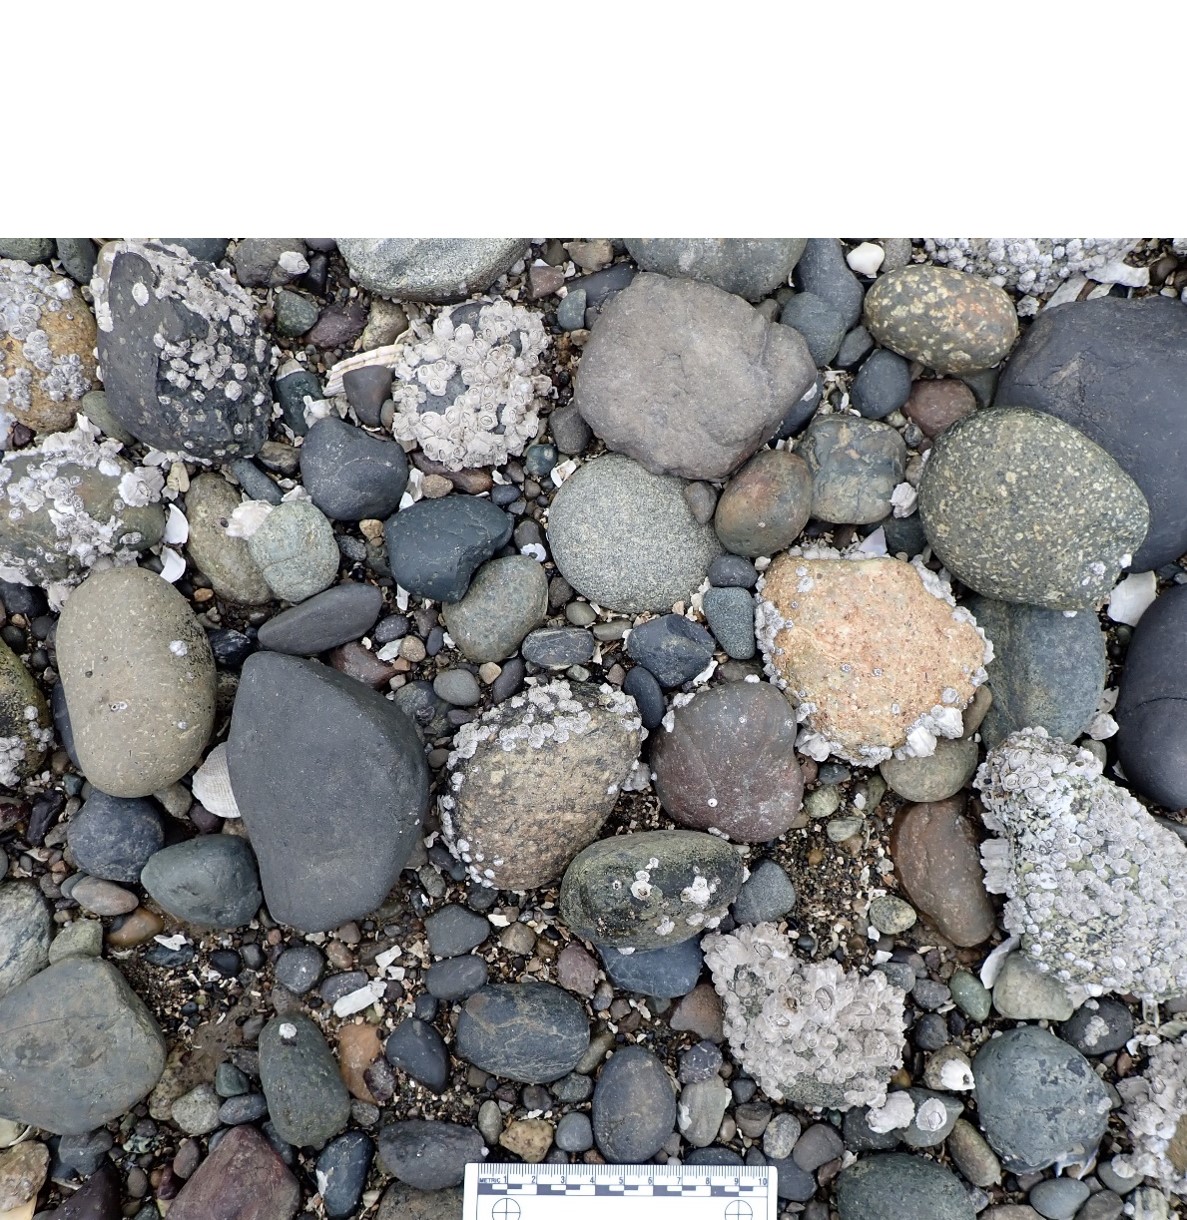
Beach sediments
Sediment grain size
At some locations, we collect samples of beach surface sediments to analyze grain size. These samples can either be physical -- a small scoop of sand we collect into a bag and bring back to the lab to sieve -- or a digital photo that is analyzed using computer-based, photogrammetric algorithms. Understanding grain size distribution and change over time helps us track sediment transport along beaches, determine where feeder bluffs deliver sediment, and measure changes before and after restoration.
Cobble movement
We use radio frequency identification technology to track the movement of individual rocks along a beach over time. First, we microchip the rocks using passive integrated transponder (PIT) tags. Then we use radio frequency identification technology tracking antennas to locate the rocks. This is specifically useful for monitoring our cobble berm projects to understand how the rocks are moving. We periodically recover the tagged rocks to measure how their size, shape, and weight has changed as they interact with the revetment.
Related links
Contact information
Heather Weiner (she/her)
Coastal Geomatics Scientist
heather.weiner@ecy.wa.gov
360-490-5562