

Measuring bluff erosion in Clallam County
Landowners occupying bluff-top properties and managers responsible for protecting beach and fish habitats are intensely interested about the distribution and variability of erosion rates of coastal bluffs made up of unconsolidated glacial deposits. The first step toward developing a coastal sediment "budget" starts by assessing the degree to which bluffs are retreating as well as the volume of sediments being deposited to nearshore areas.
Project overview
This project entails using a boat-based Lidar system to map and monitor bluff erosion patterns from June 2012 through August 2013. This information augments traditional data sources such as past aerial photography, GPS-based beach profile data), and airborne Lida. These data are analyzed to determine bluff retreat rates and associated sediment volume changes for the Elwha and Dungeness littoral cells in Clallam County.
We started by calculating historical bluff erosion rates from 1939 through 2012 using aerial photos and airborne Lidar. In addition, annual bluff retreat rates from 2012 through 2013 were calculated using GPS-based beach profile and boat-based Lidar data. This data showed variation of up to 4.86 meters a year. These rates, derived from short-time scales, should not be used directly to predict decadal-scale bluff recession rates since they tend to represent short-term localized events rather than long-term, sustained bluff retreat.
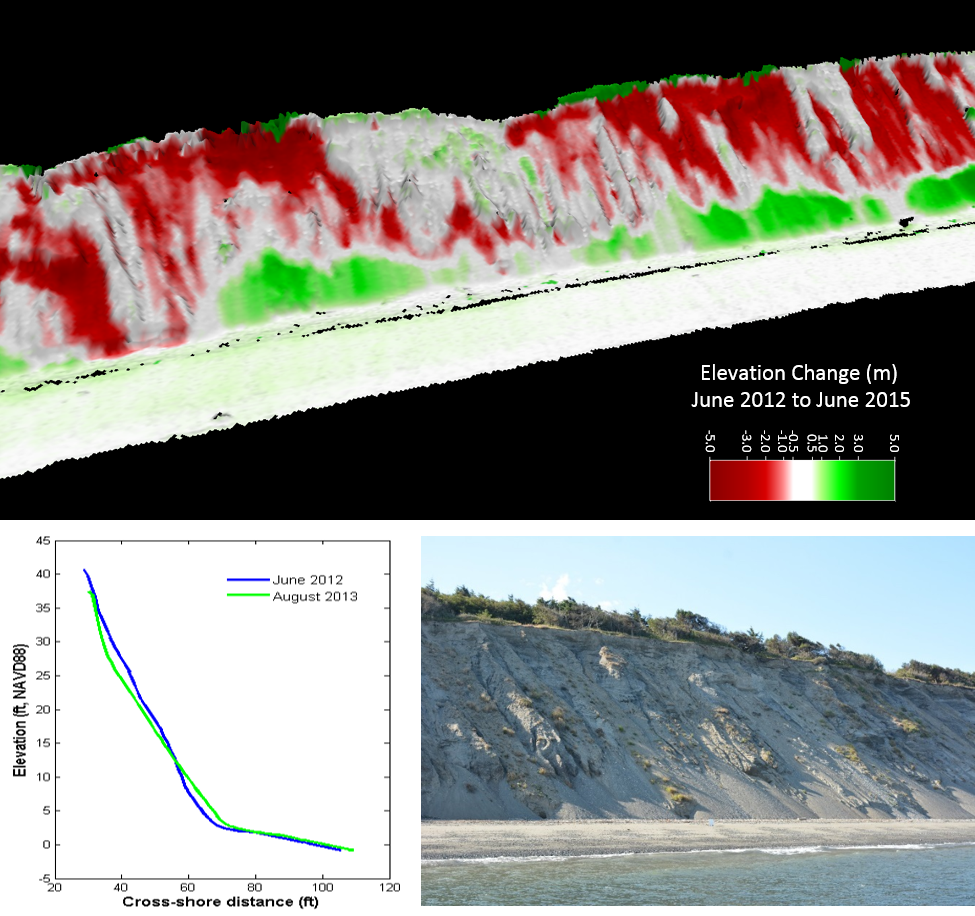
Bottom left: 2D cross-section view of the bluff face showing what it looked like in 2012 vs. 2013 after the top of the bluff eroded and sediment accumulated at the toe of the slope.
Bottom right: Photo of bluff-backed beach in Clallam County.
Related links
Contact information
George Kaminsky, PhD, PE
Coastal Engineer
>george.kaminsky@ecy.wa.gov
360-407-6797