

River & stream water quality index
How is your river doing? The Freshwater Quality Index, sometimes called the WQI, summarizes and presents water-quality data as a number ranging from 1 to 100, with a higher number indicating better water quality. The WQI can be found on individual station pages in the Freshwater Information Network data application.
See below to learn more about the Freshwater Quality Index, its development, and how to calculate a WQI based on your own data.
See how your river or stream is doing
Data presented in the Freshwater Quality Index helps indicate whether water quality is good, meeting standards to protect aquatic life, whether it is of moderate concern or is poor and doesn't meet expectations. The index ranges from 1 to 100; a higher number indicates better water quality.
|
WQI score |
Status |
Color code |
|---|---|---|
|
80 and above |
Good — meets expectations —lowest concern |
lavender |
|
40 to 80 |
Moderate concern |
light yellow |
|
40 and below |
Poor - does not meet expectations - highest concern |
red |
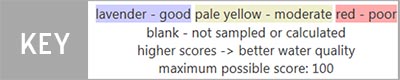
The WQI graphs show lavender for low concern, light yellow for moderate concern, and red for high concern or poor water quality.
Find the Water Quality Index
The Water Quality Index is in a tab on individual station pages in the Freshwater Information Network application. Select your station of interest from the application map, and click the "location data" link to get to the station page that contains the WQI. The tabs are toward the bottom of the page. Click on the Freshwater Quality Index tab to find the WQI charts.

Most pages show trends over time, though the amount of time covered varies by station. Each page has four graphs: scores for the most recent water year (October through September), scores by constituent, scores by month, and general WQI score trends for that station year-by-year. The "scores by constituent" include eight analytes/parameters, including fecal coliform bacteria, dissolved oxygen, and temperature.
Calculate WQI based on your own data
The Water Quality Index spreadsheet (Version 6) is a downloadable tool for calculating a WQI score based on your own data.
Learn about the methodology
A Water Quality Index for Ecology's Stream Monitoring Program is a report that describes the development of and the methodology for the Water Quality Index.
Related links
Contact information
Markus Von Prause
River & Stream Water Quality Lead
mark.vonprause@ecy.wa.gov
206-305-8179
Thomas Jetson
Freshwater Monitoring Unit Supervisor
thomas.jetson@ecy.wa.gov
564-669-1733