

Summer is finally here and that means sun (great!), but it also means wildfire smoke (not great!).
We can’t prevent wildfire smoke, but we can help you stay safe during heavy smoke, and keep you informed about what’s happening around the state. One of our major tools for doing that, our statewide air quality monitoring map, recently got a revamp and looks a little different this year.
Together with our partners at Washington's seven local clean air agencies, tribes, and the U.S. Environmental Protection Agency, we operate a network of more than 70 air quality monitors around Washington state. These monitors do more than just keep an eye on smoke — they track a wide range of different types of air pollution, and also record data on weather conditions.
The monitoring data is used by researchers and scientists, it informs permitting and health decisions, and, of course, it’s pretty useful for all of us when smoke descends across Washington.
In 2018, at the peak of the massive plumes of wildfire smoke blowing south from British Columbia, the monitoring page received more than a million hits a day (2019 was a relatively mild wildfire year and web traffic declined proportionately).
While the monitoring site is popular, there were a number of areas where it needed improvement, said Chuck Pierce, manager of Ecology’s Air Quality Information Technology and Telemetry unit.
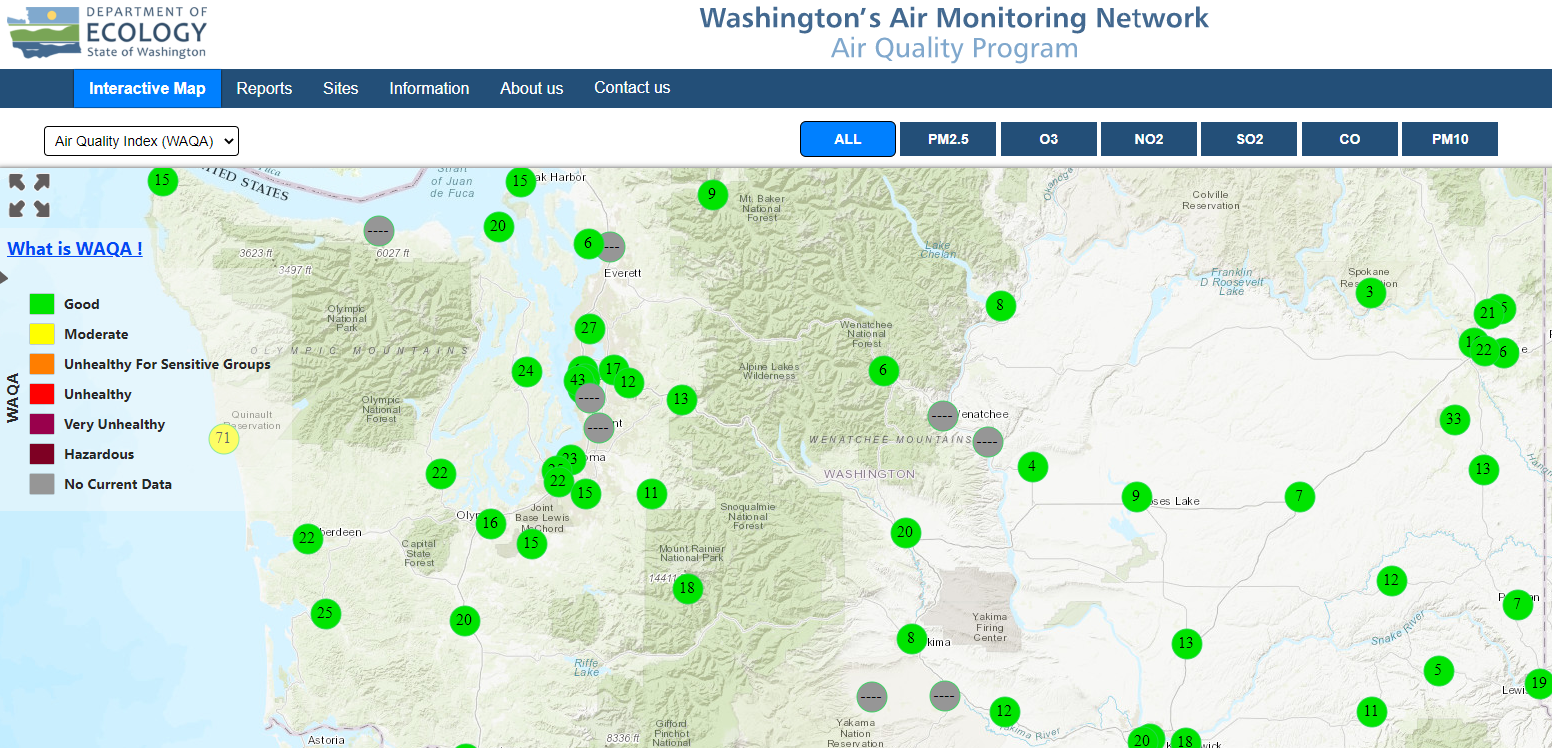
“The monitoring site offers a huge amount of data,” Pierce said. “It goes much deeper than just the green-yellow-red dots that most people rely on. We wanted to make all of that data easier to find and easier to use, without compromising the ability for people to get current conditions at a glance.”
The most visible change is that, in addition to a snazzier map of Washington, the dots for each monitor now offer a number along with a color. The number corresponds to the Washington Air Quality Advisory value measured at the monitor.
Usually, that number will reflect the amount of particulate pollution in the air — the type of pollution that we’re concerned about in wildfire smoke (although vehicles and industry are also sources of particulate pollution). But, if another type of air pollution is found at a level that poses a greater danger to human health, the dot and the number will reflect that pollutant instead.
Visitors who really want to dig into the data at a particular site can now easily download the information into a spreadsheet — or they can graph the results right on the site.
Most visitors will never notice some of the most important changes to the new site — because the Air Quality team put a lot of effort into making the site easier to navigate and more accessible for people with visual impairments.
“People all across Washington rely on us to deliver timely, accurate air quality information,” Pierce said. “We want to make sure that we’re giving them the data they need as quickly and easily as possible.”