

Mercury in fish tissue
Mercury Trends in Freshwater Fish is a long–term, statewide study on mercury levels in edible fish in 30 Washington waterbodies. We collect freshwater fish from six waterbodies every year for mercury analysis and use the data to assess changes and estimate trends in mercury across the state. We provide data to the Department of Health to update state fish consumption advisories.
Why we monitor mercury
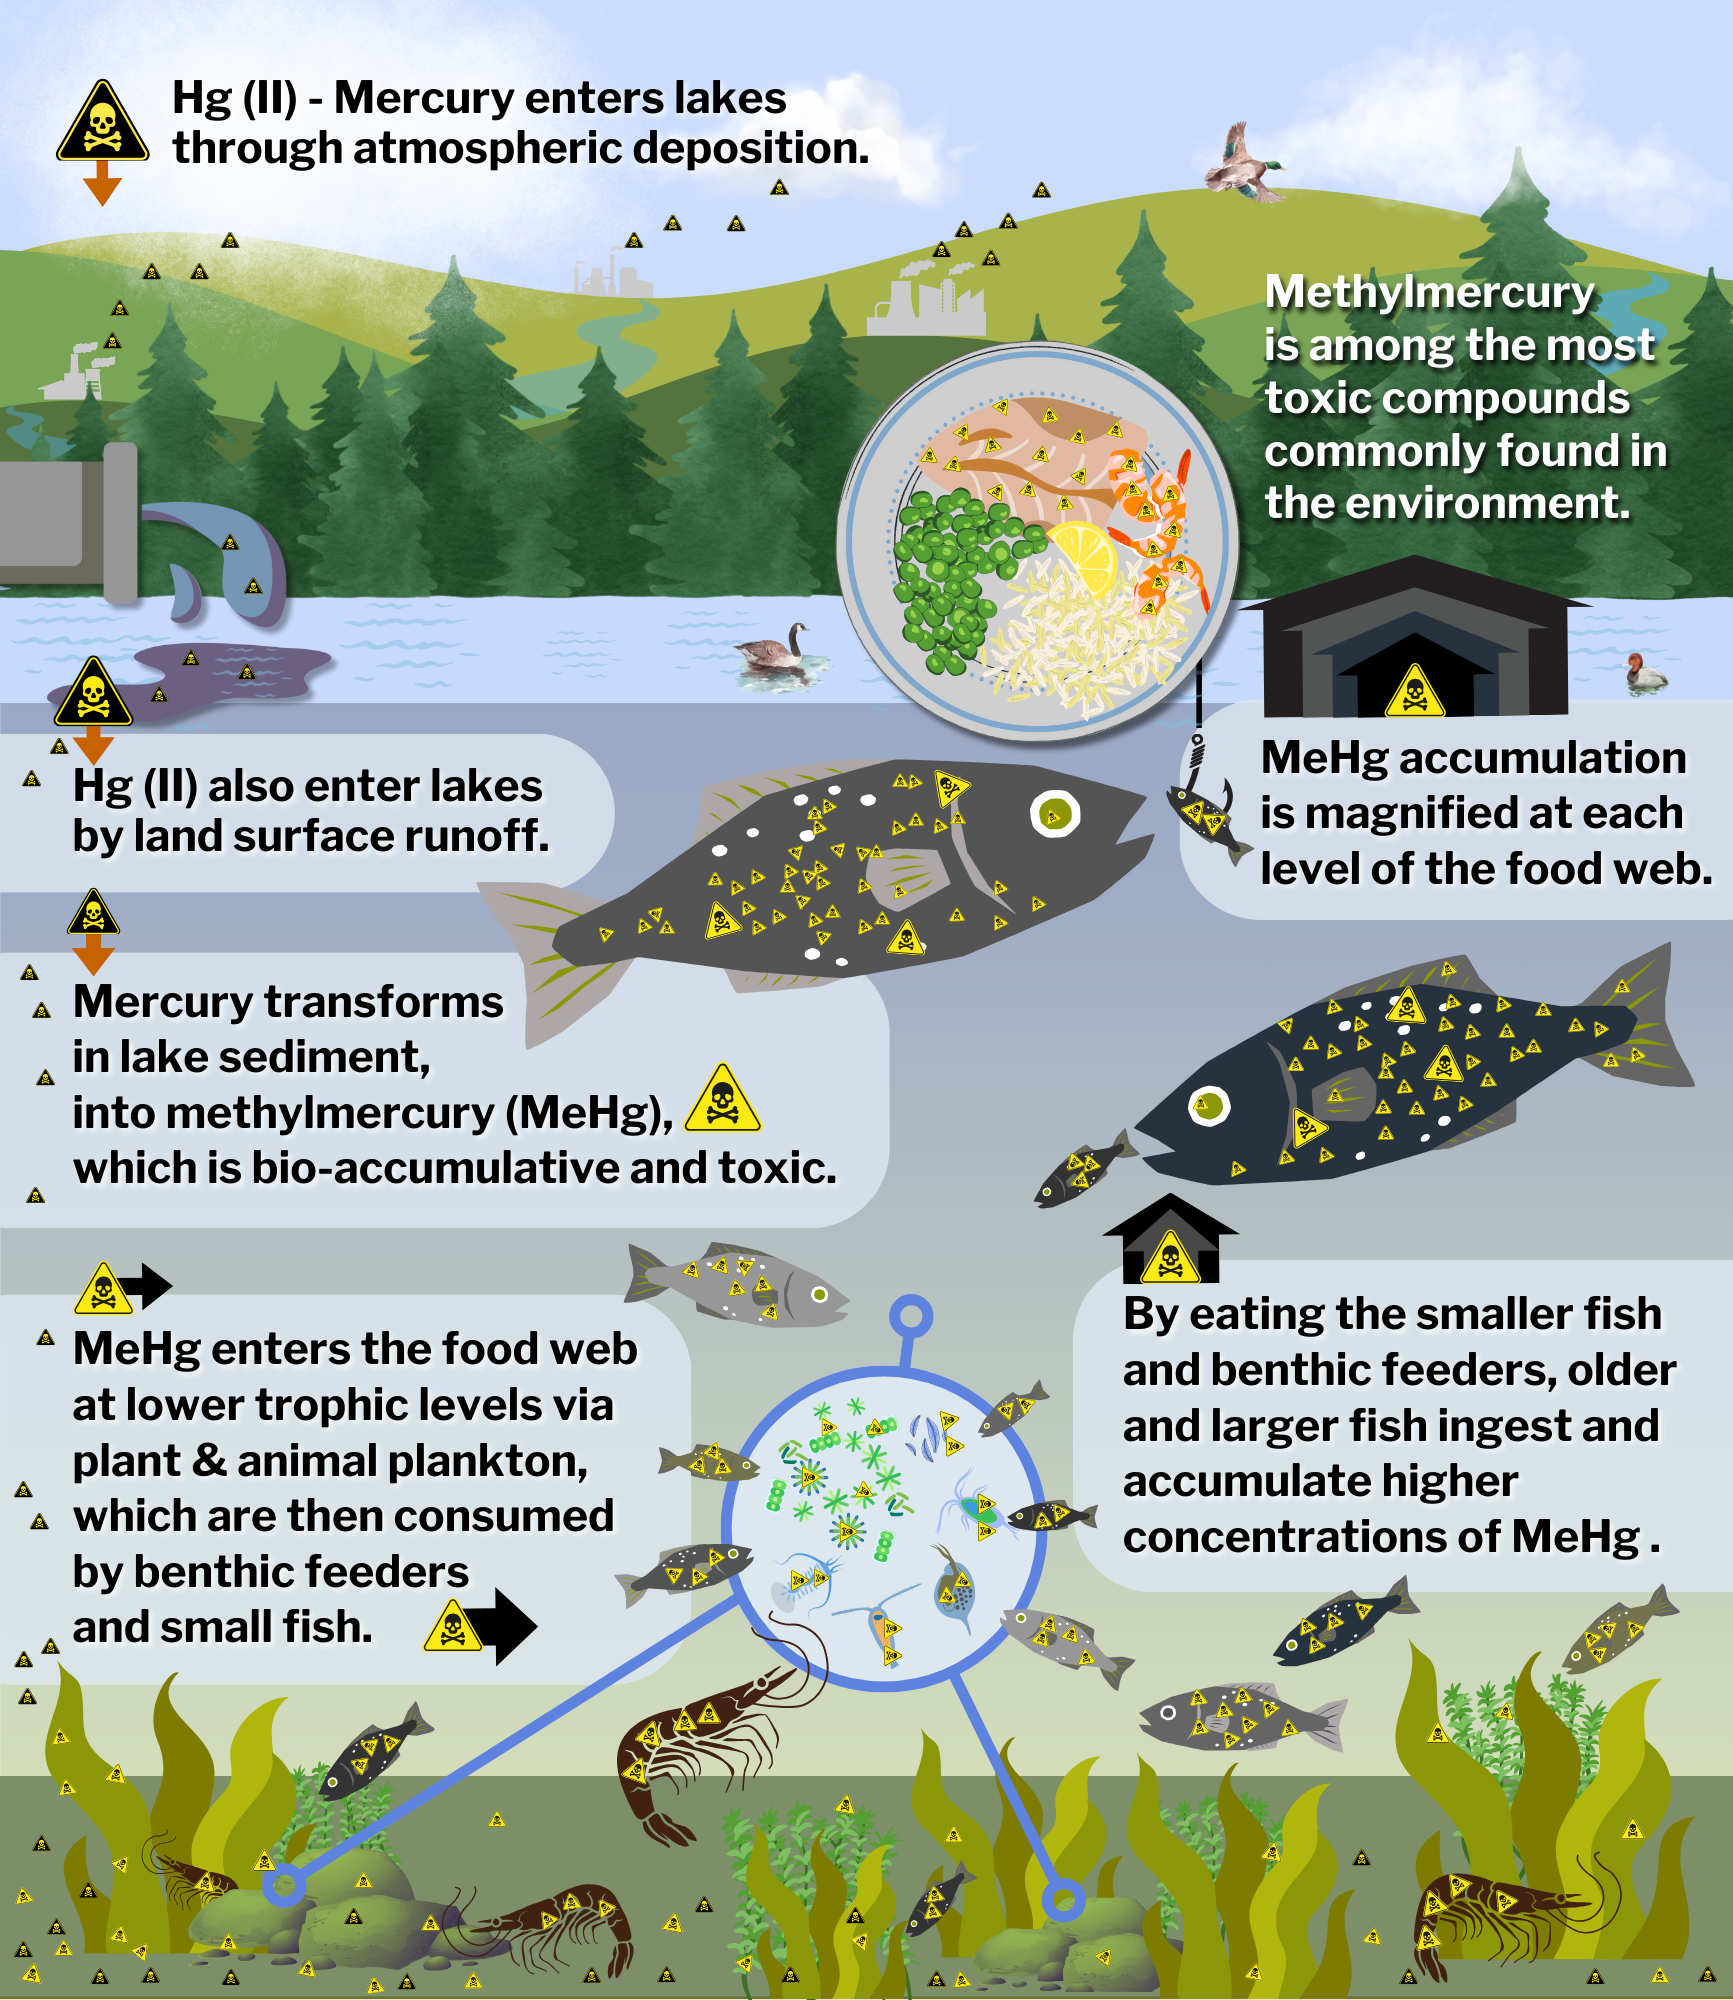
How mercury enters fish as methylmercury in freshwater systems.
Mercury is toxic in any form and can persist in the environment. In Washington, most people are exposed to mercury through eating contaminated fish.
Our long-term monitoring study was spurred by the Chemical Action Plan (CAP) for mercury (2003), a collaboration between our agency and the Department of Health to reduce mercury in the state.
The Mercury Trends in Freshwater Fish Quality Assurance Project Plan (QAPP) and QAPP addendum define our project objectives and the procedures for monitoring mercury trends in freshwater fish.
Mercury trends
Since 2005, we've collected mercury data from freshwater fish to assess whether concentrations are decreasing or increasing. We use the data from annual sampling events to track trends in a waterbody over time. As we finalize results, we update our online StoryMap with the latest mercury trends.
Every five years we complete a full sampling cycle of all 30 waterbodies. Data from each cycle is used collectively to compare trends across the state. Measuring Mercury Trends in Freshwater Fish in Washington State: 2017-2019 Sampling Results (2023) is our latest cumulative report.
Where we monitor mercury
Today, we monitor lakes and rivers across the state in a variety of landscapes and land uses. We select waterbodies that can support a stable community of largemouth or smallmouth bass and for their site accesssbility, the fish collection potential, any history of mercury contamination, and their distance to urban areas and local point sources of mercury.
Monitoring locations
Use this map to find study IDs for all studies in each waterbody. Use these study IDs to search for data in our EIM database. To explore data further, view our StoryMap: Mercury trends in freshwater fish.
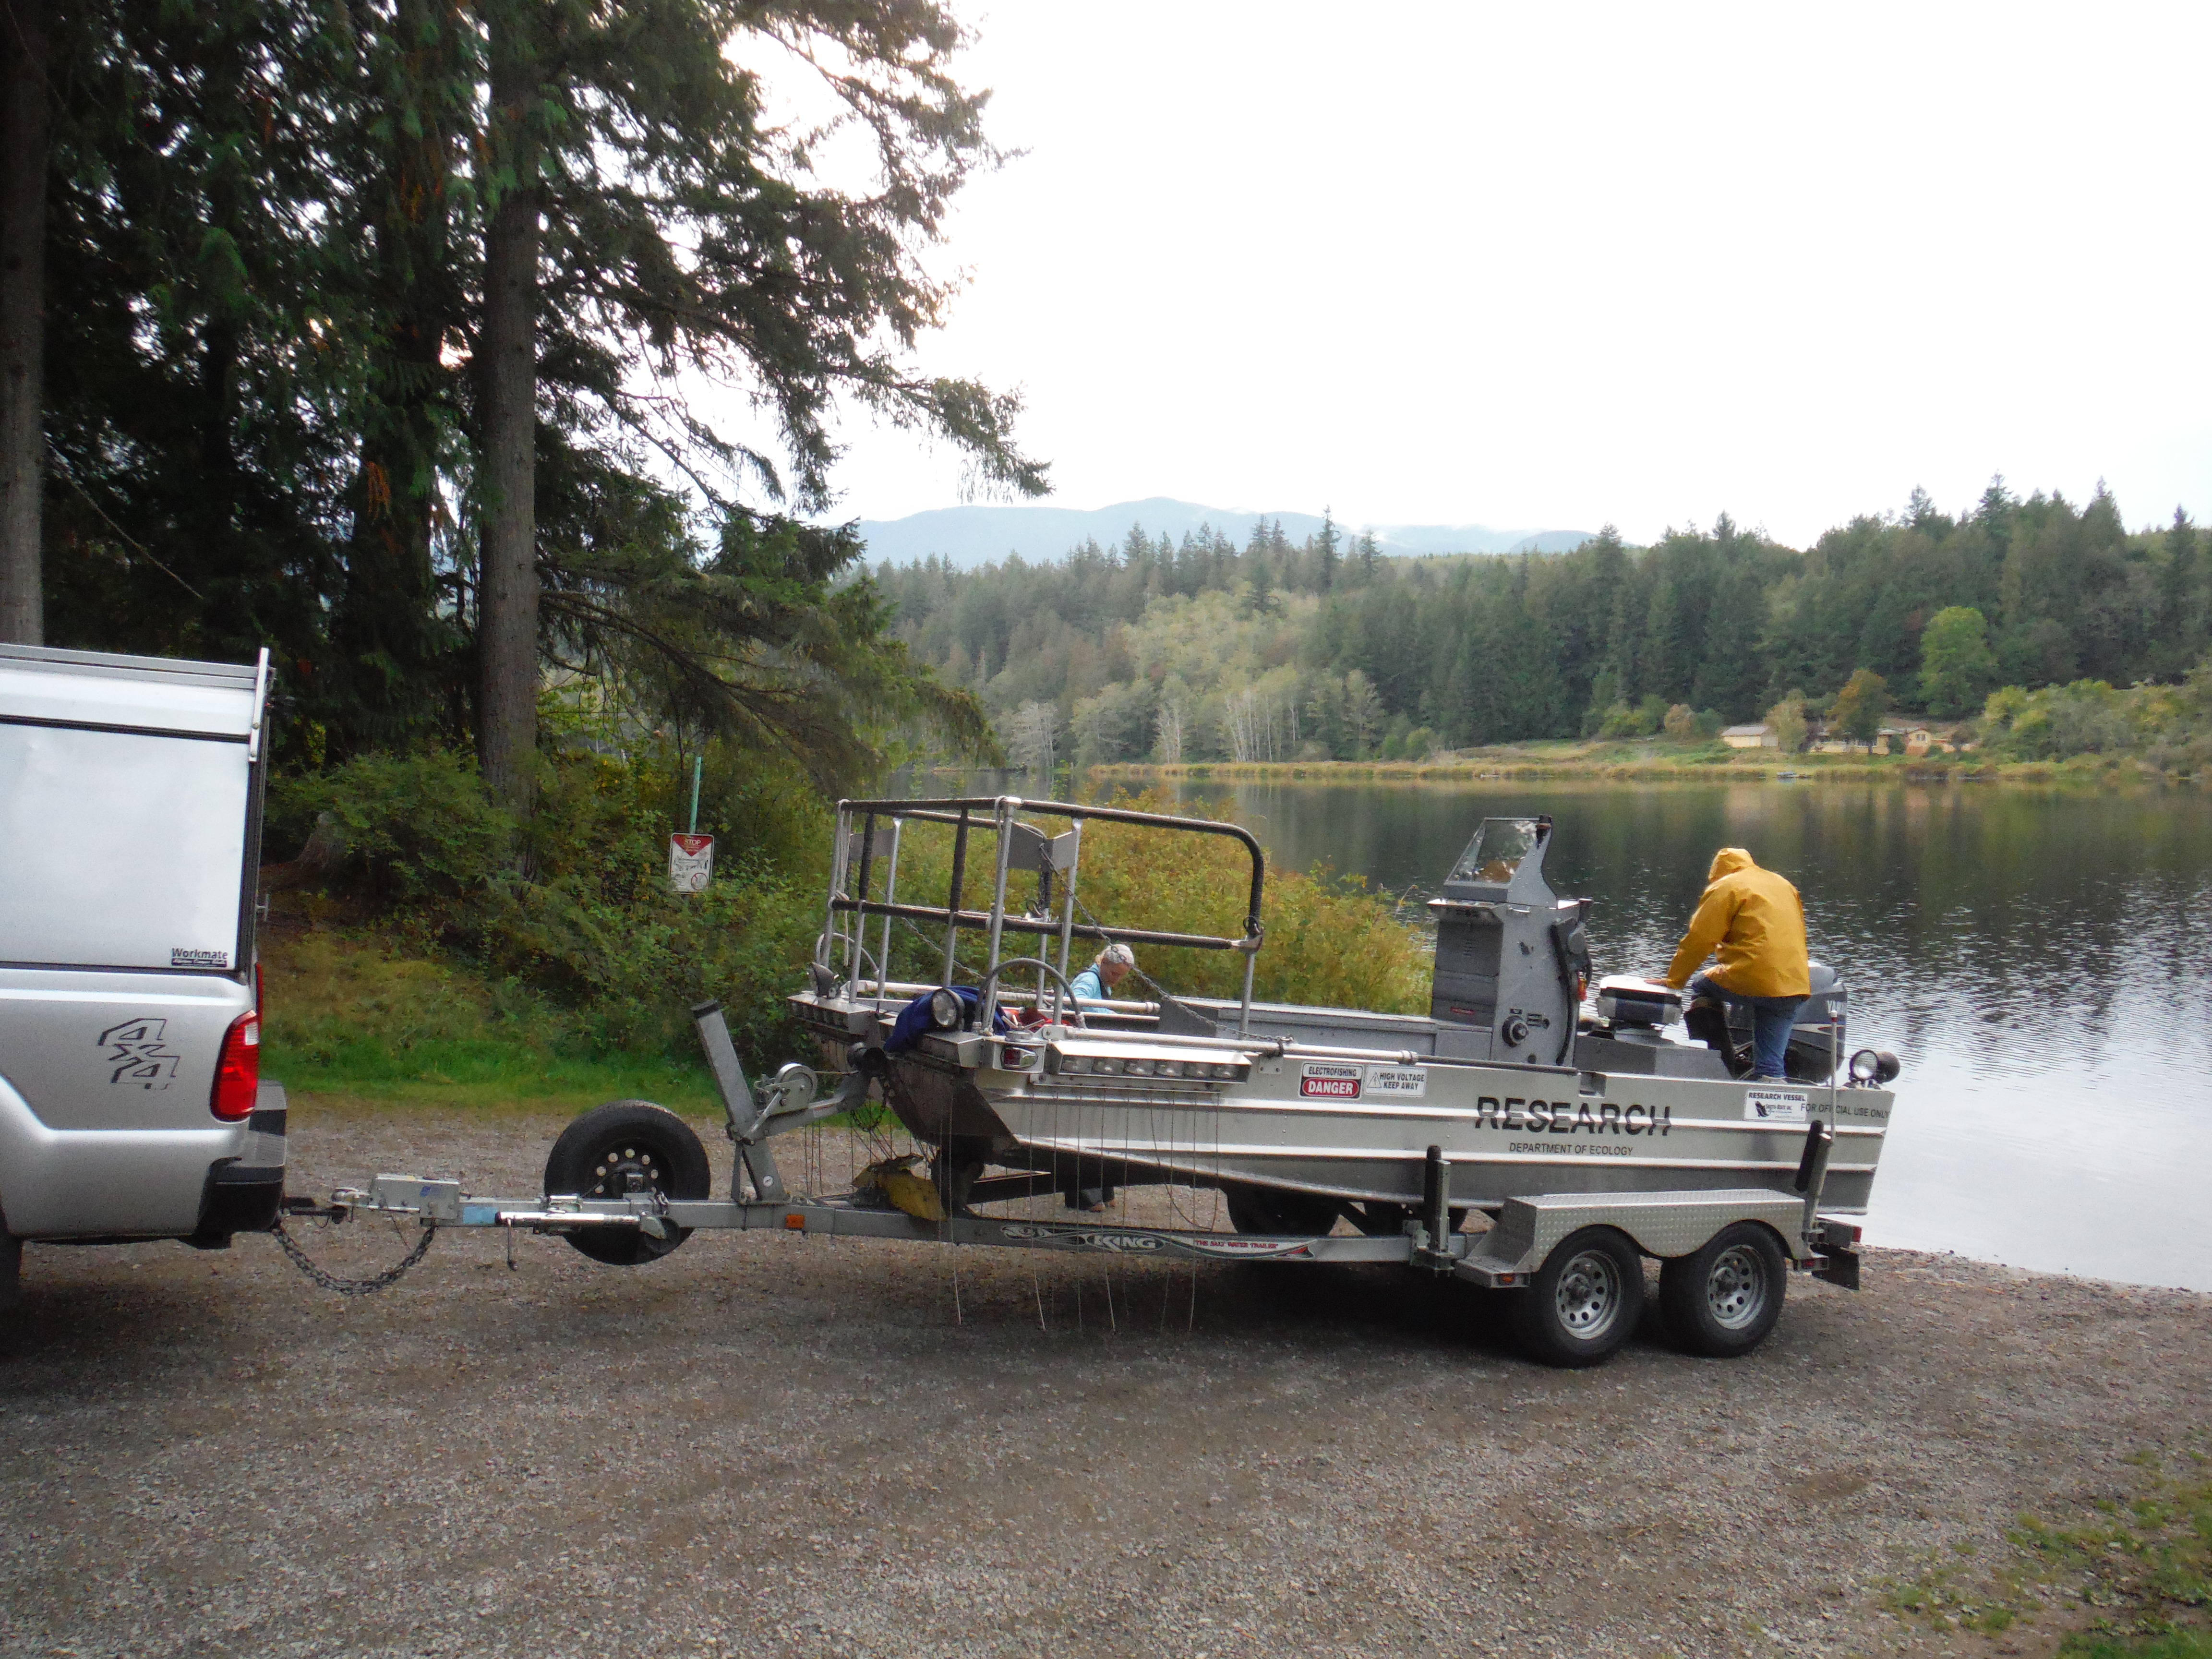
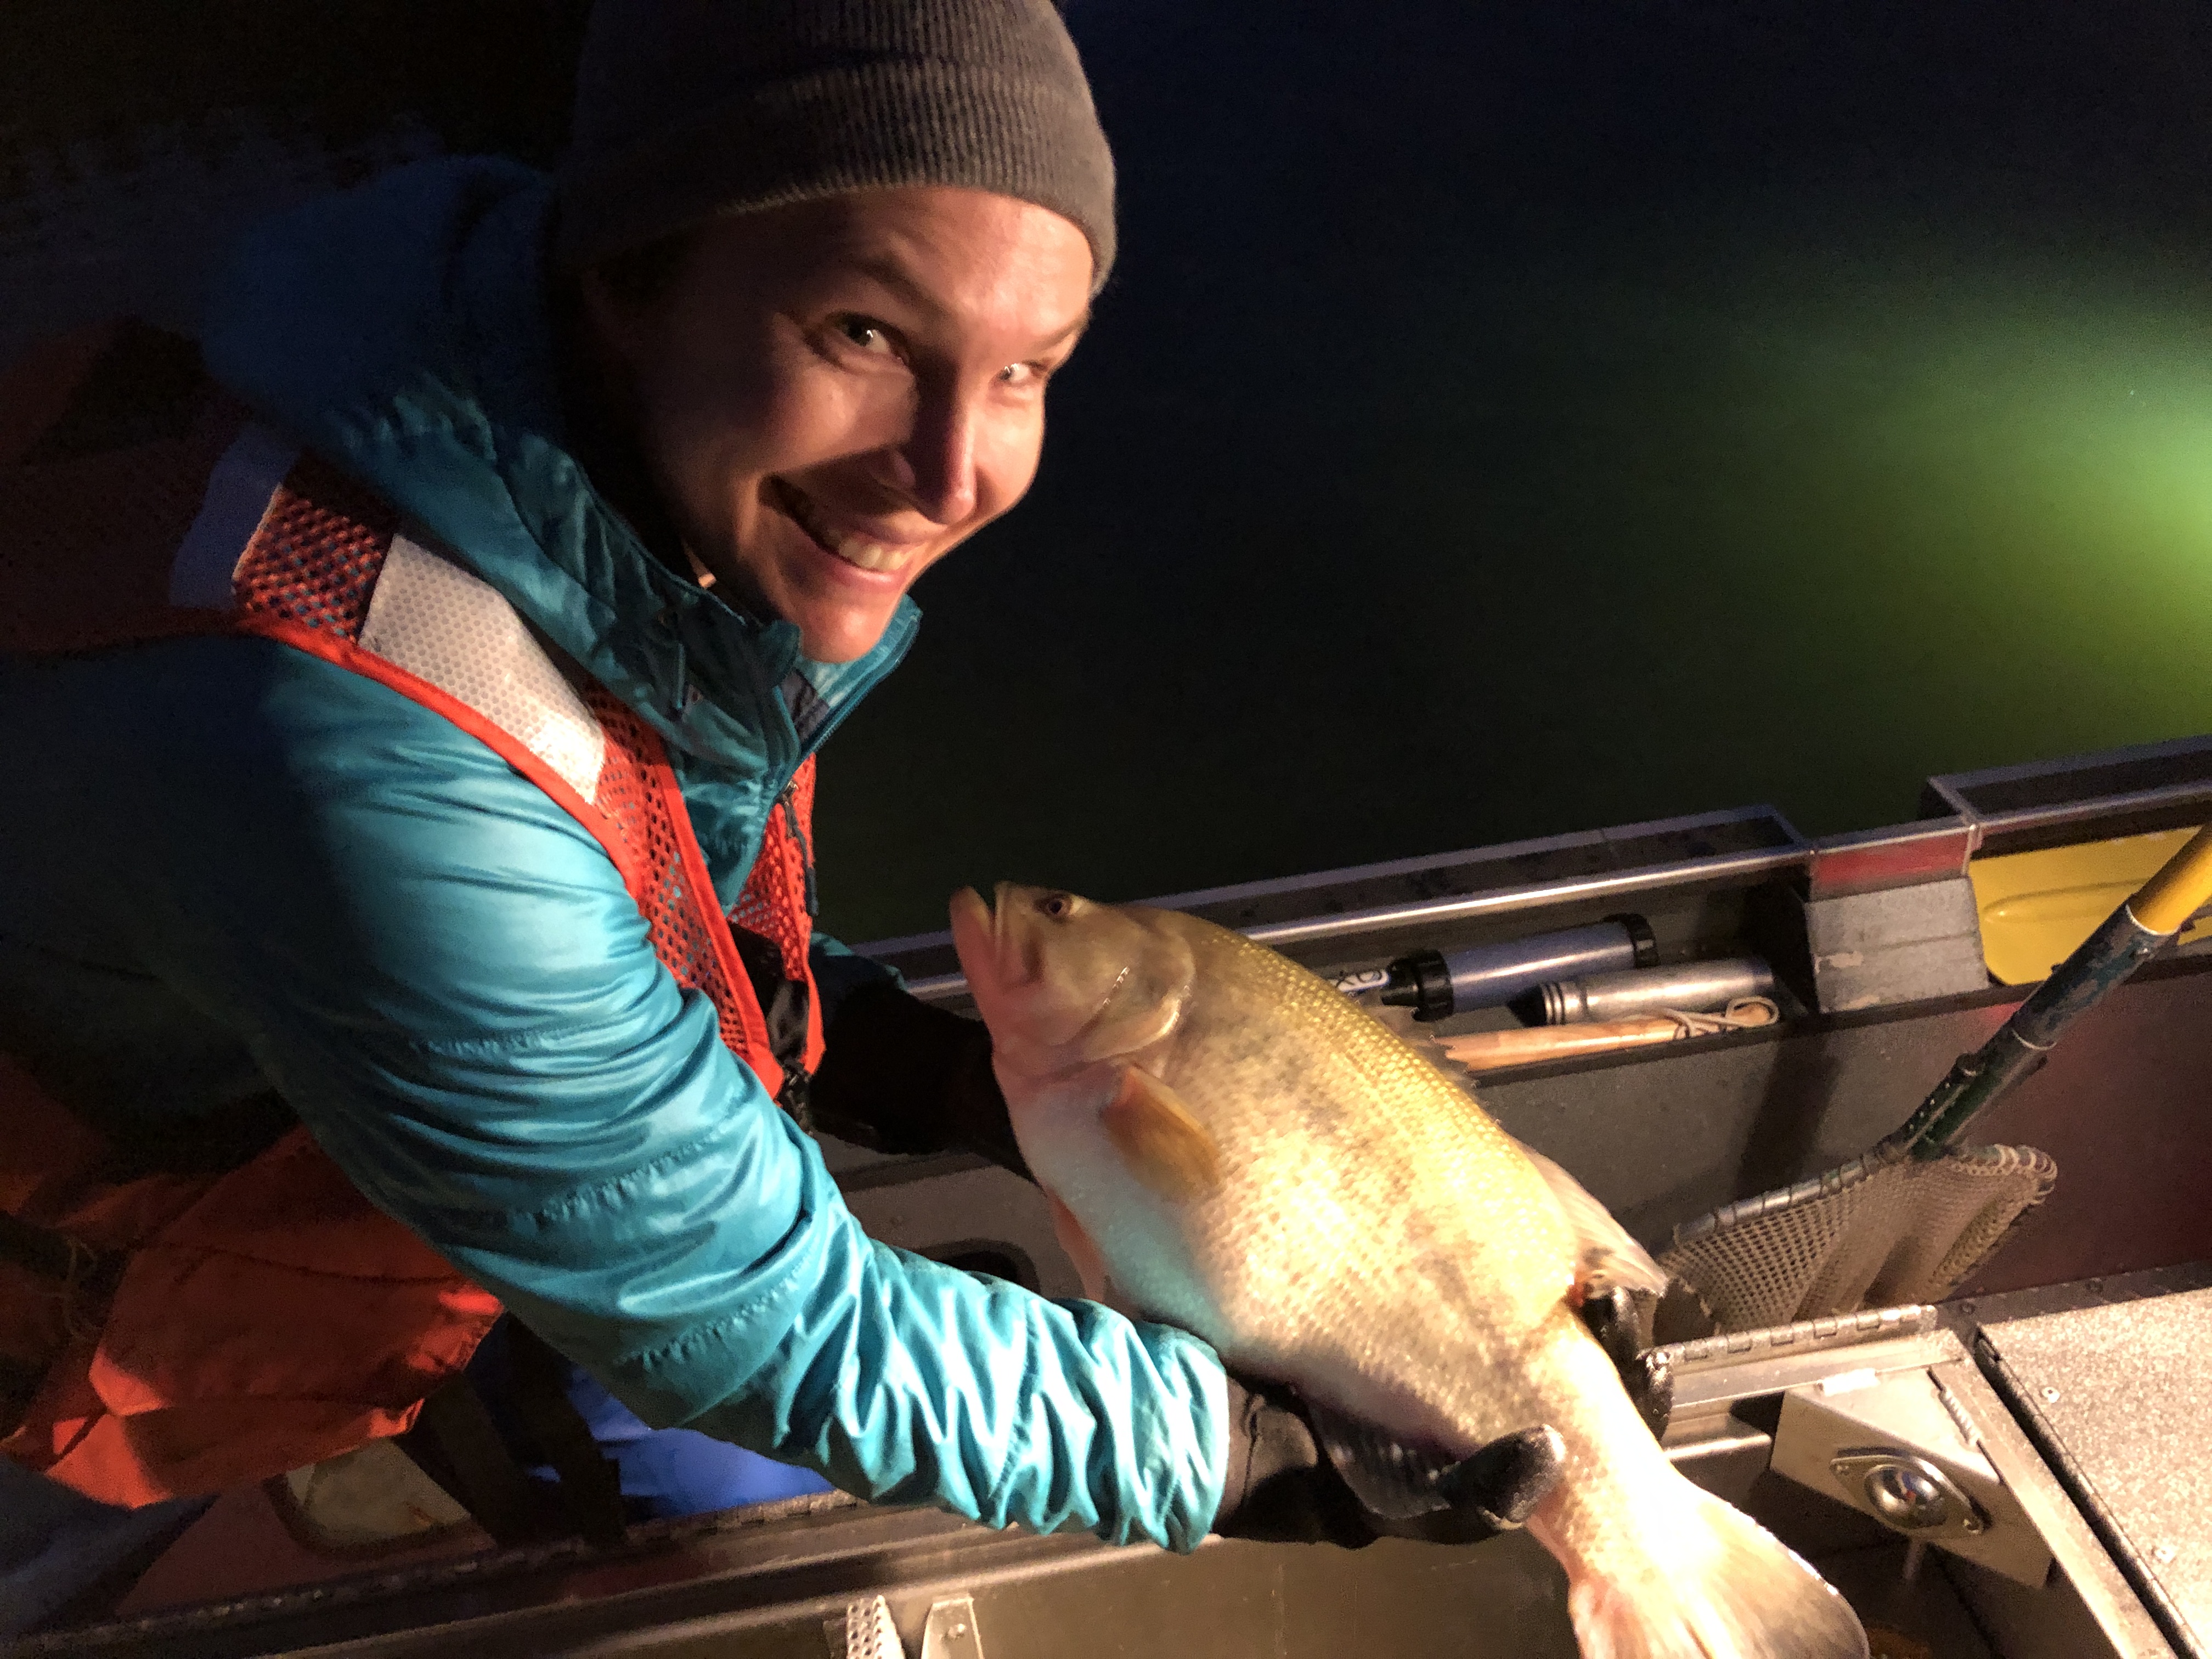
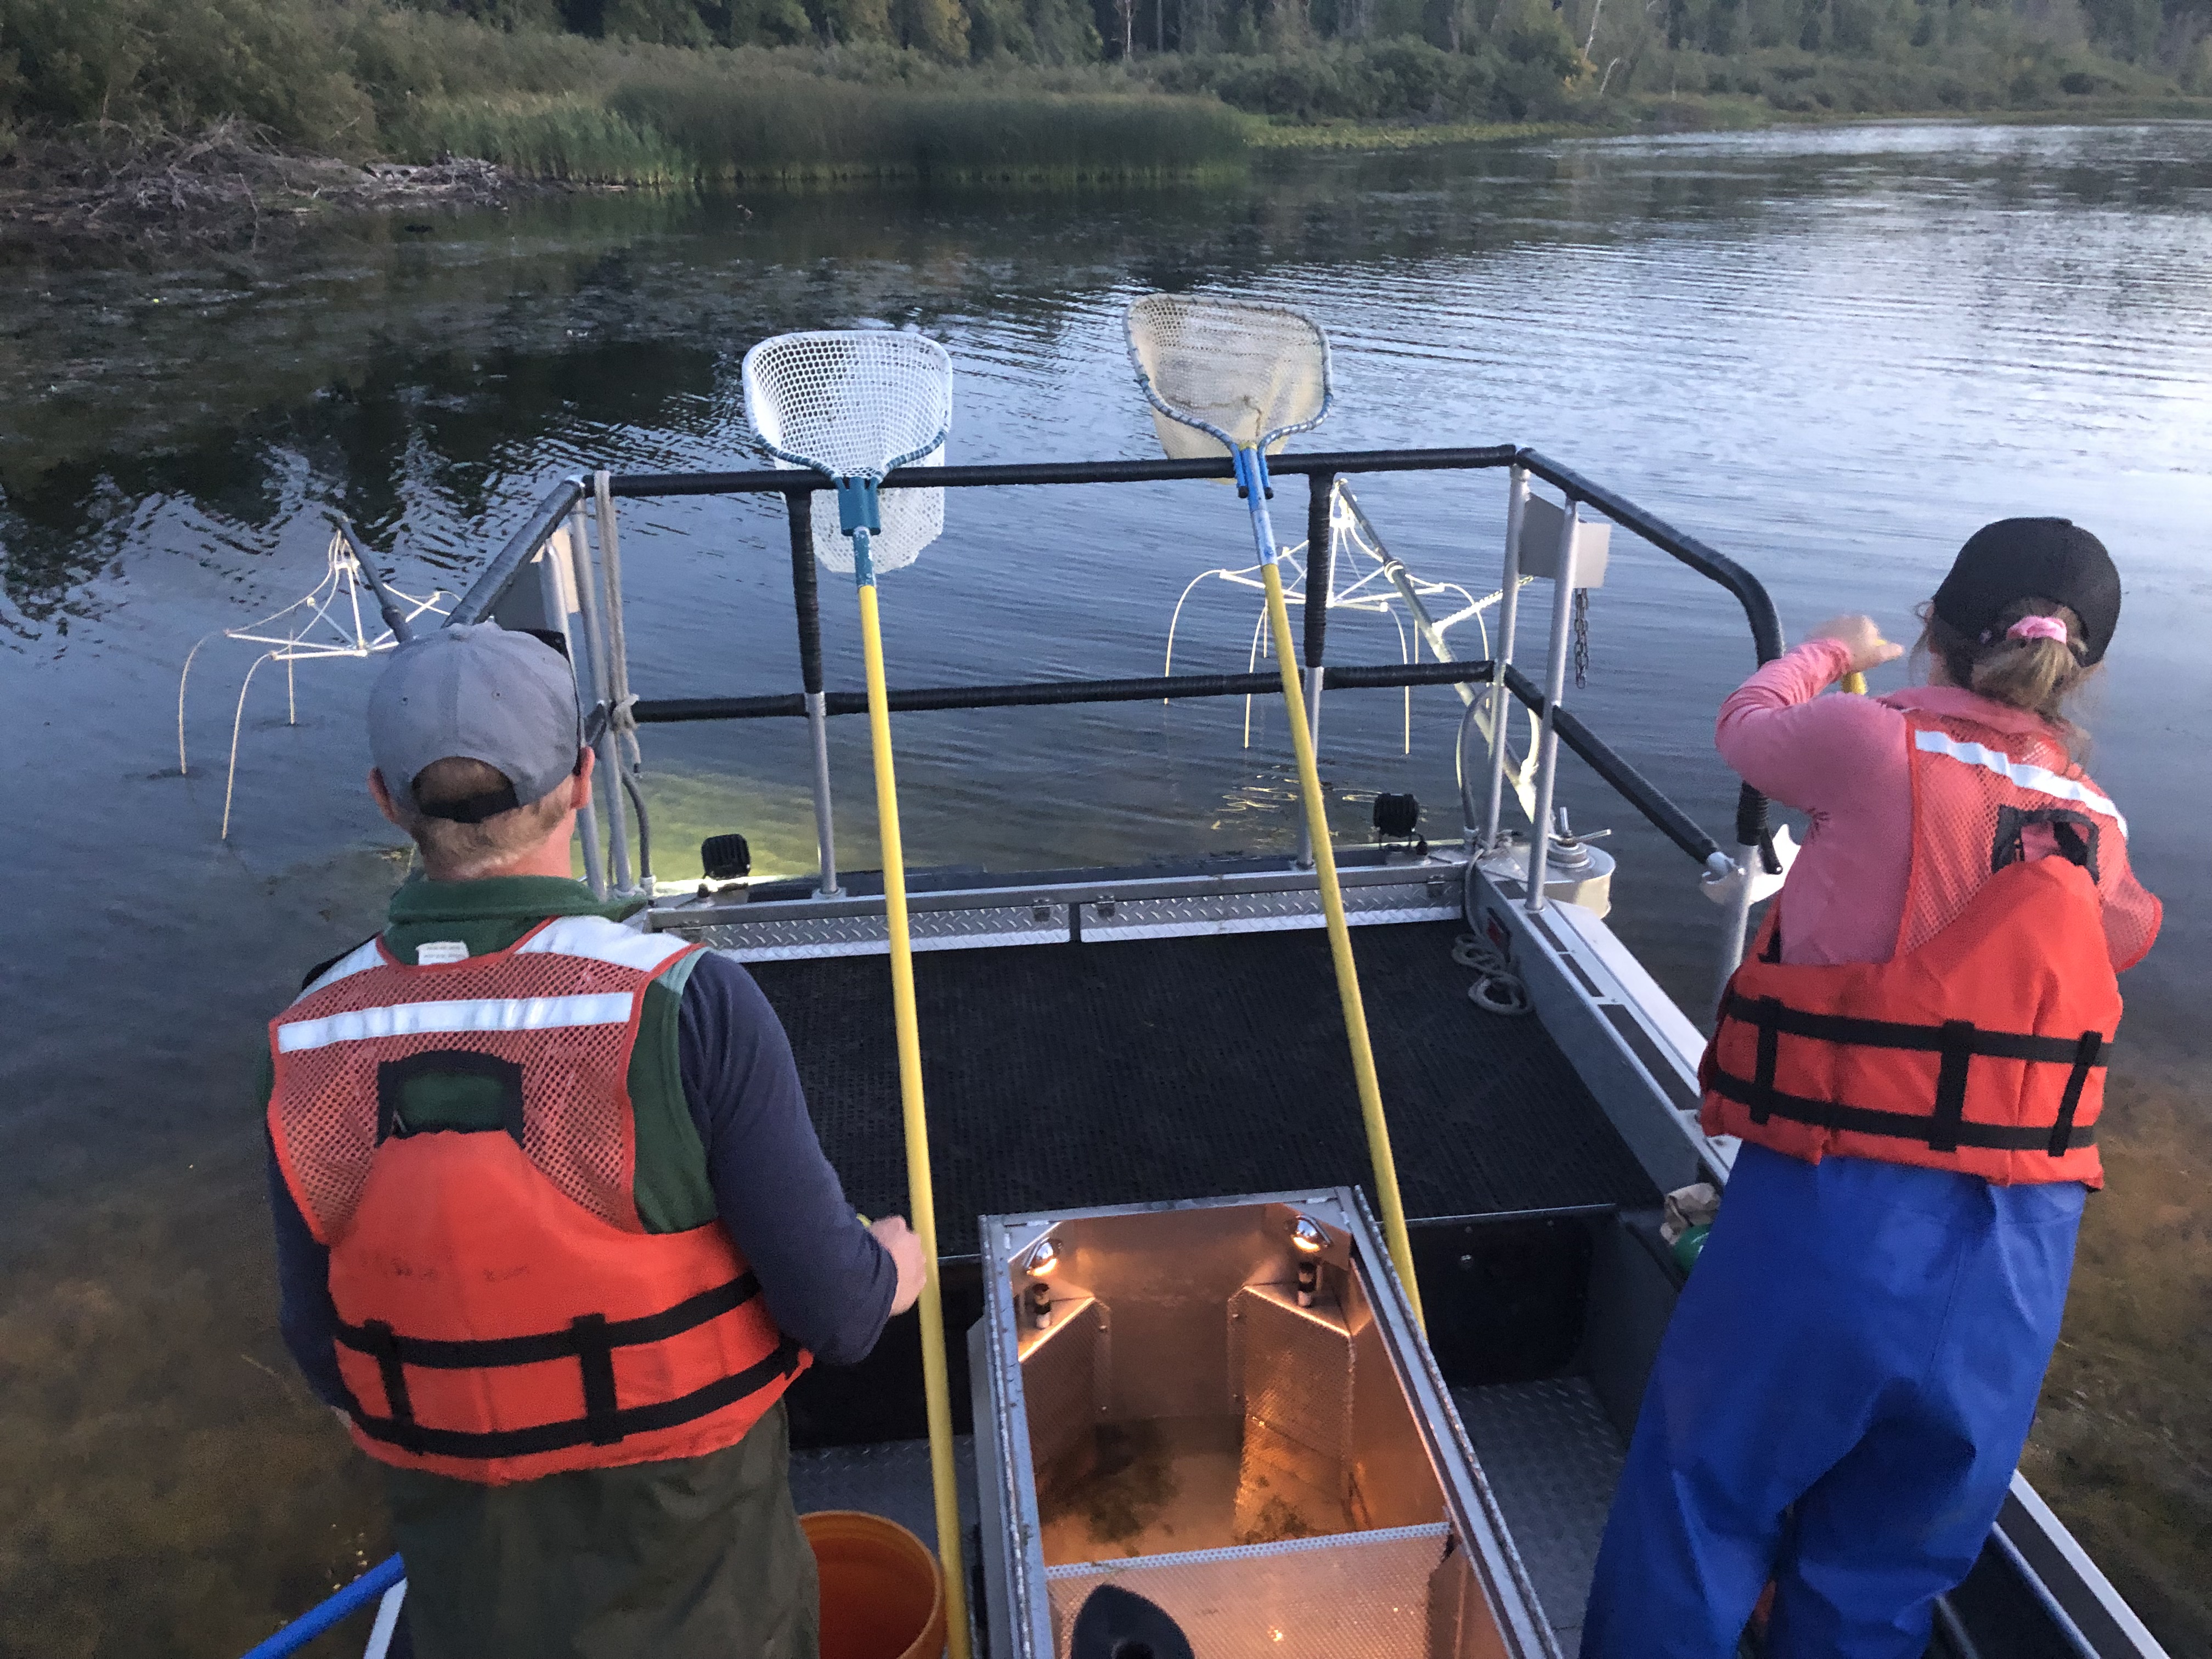
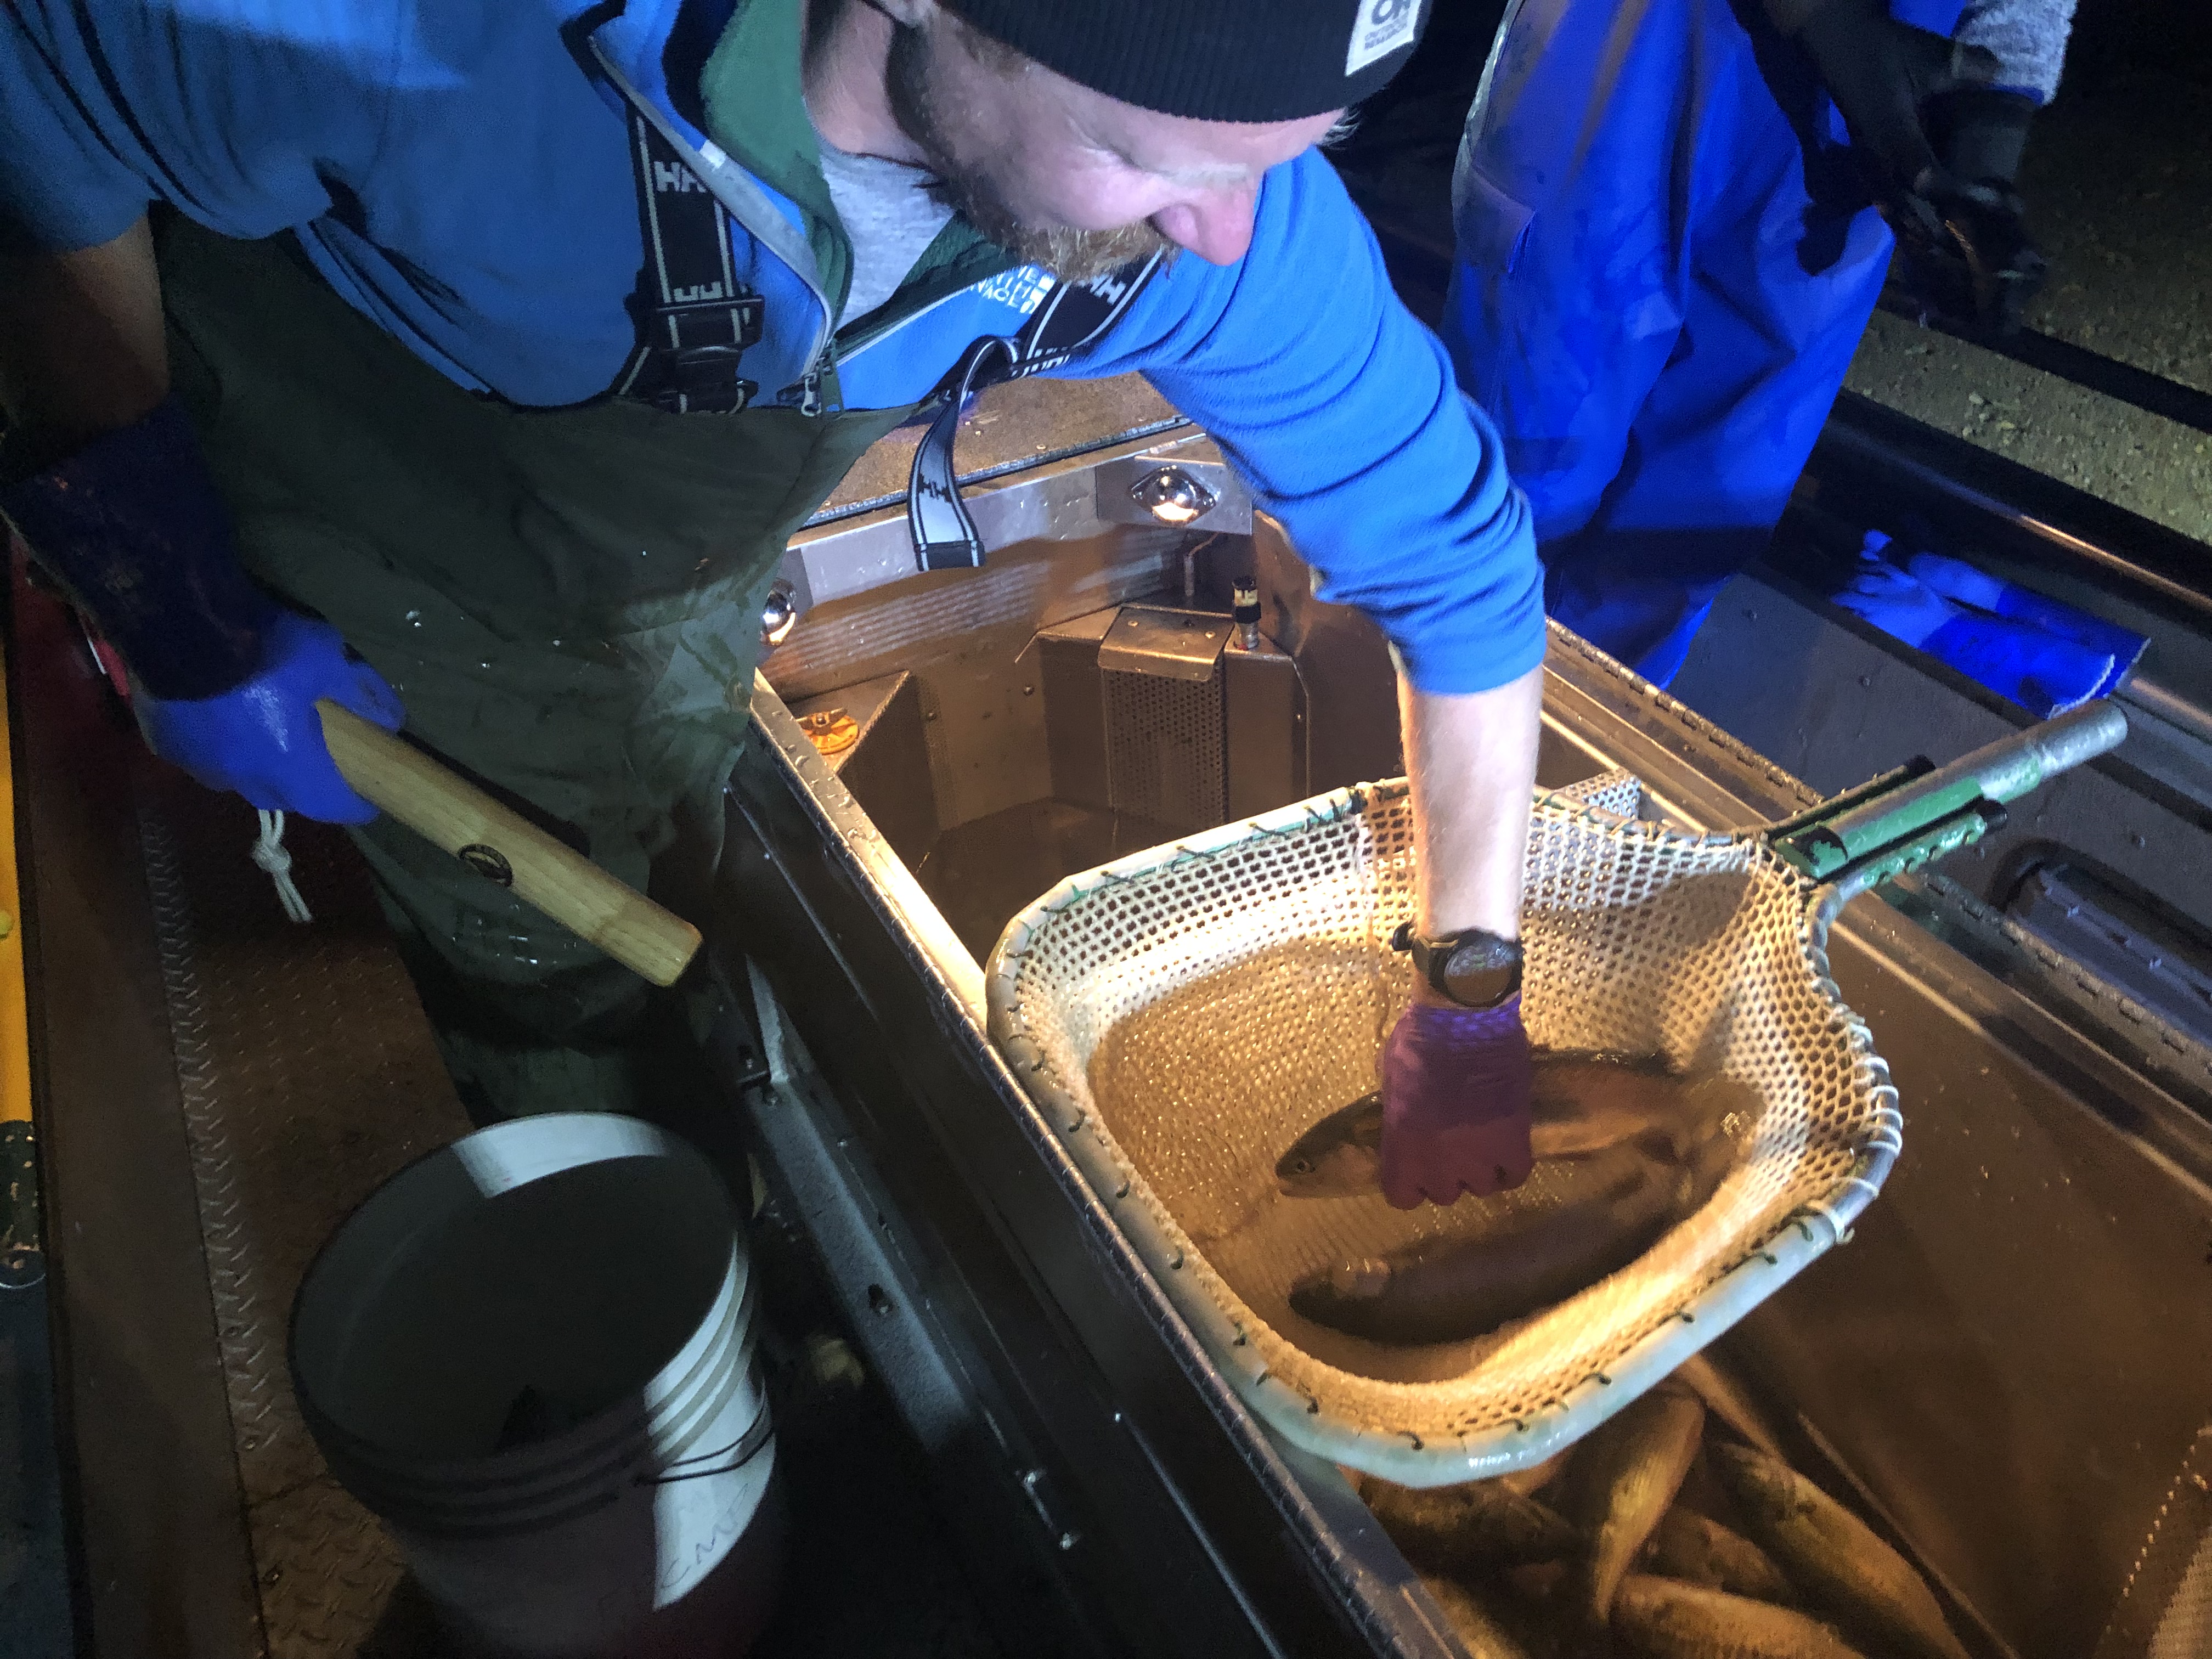
Our field crew in action
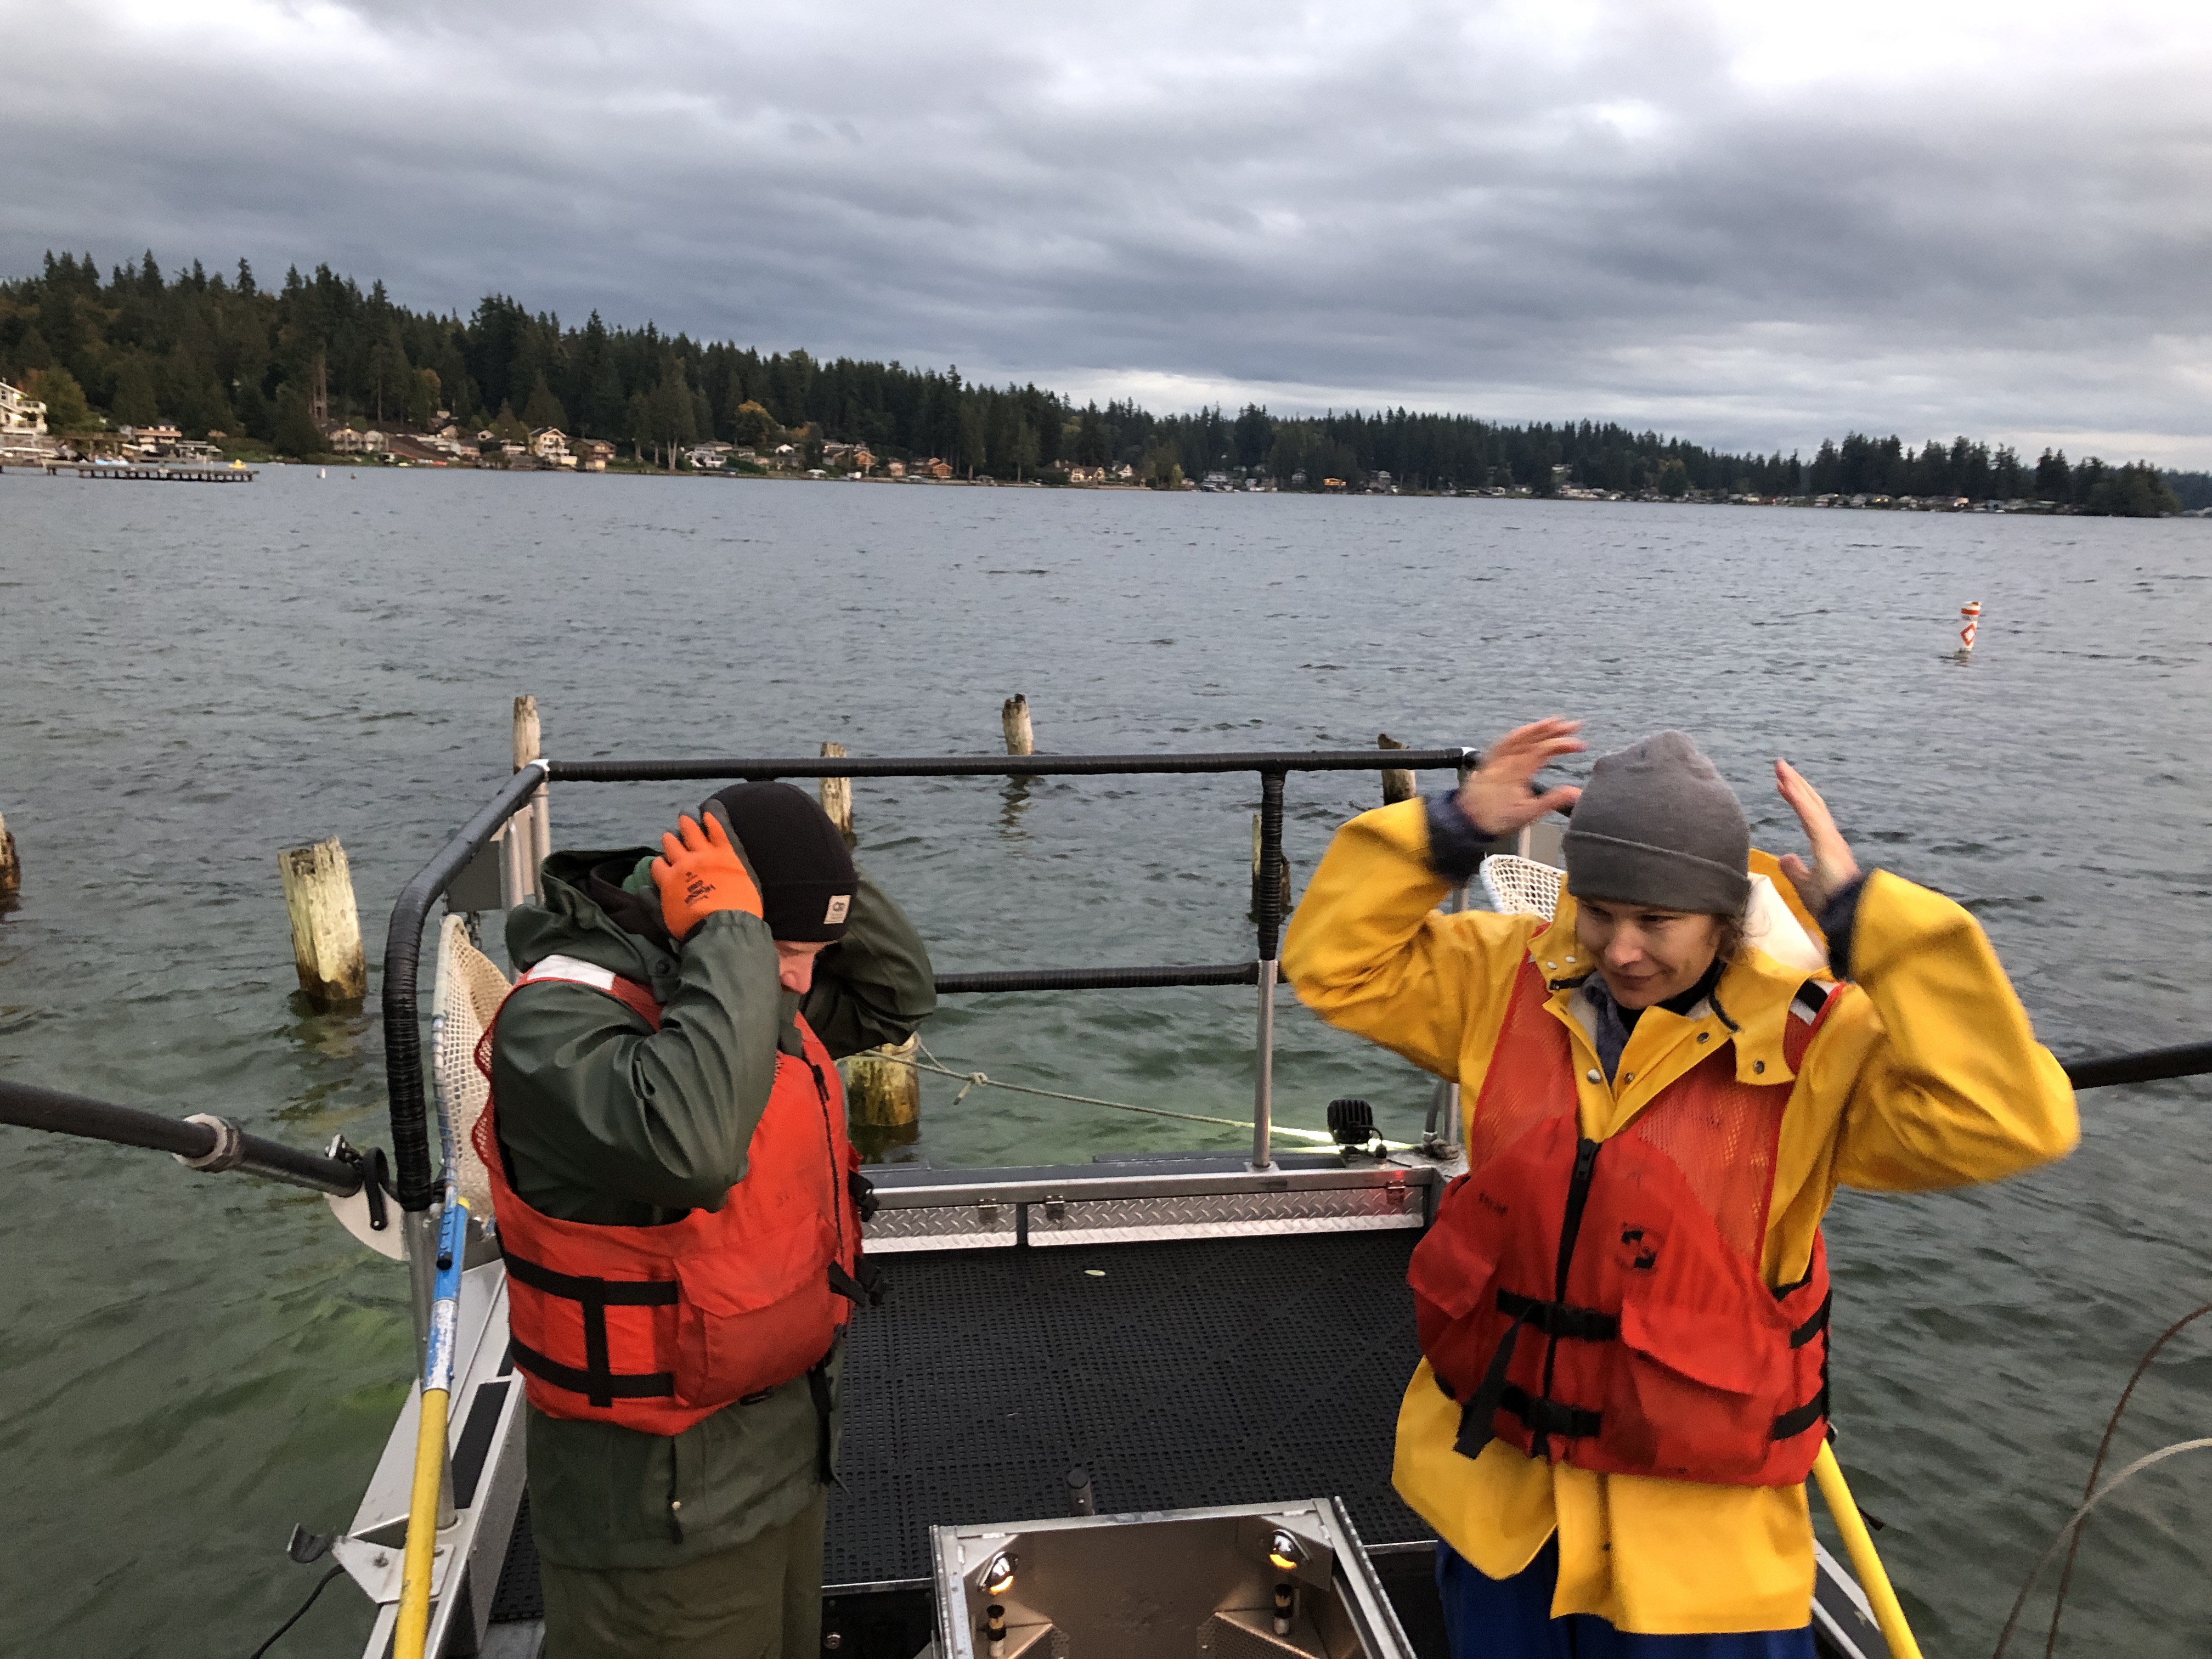
Gear check!
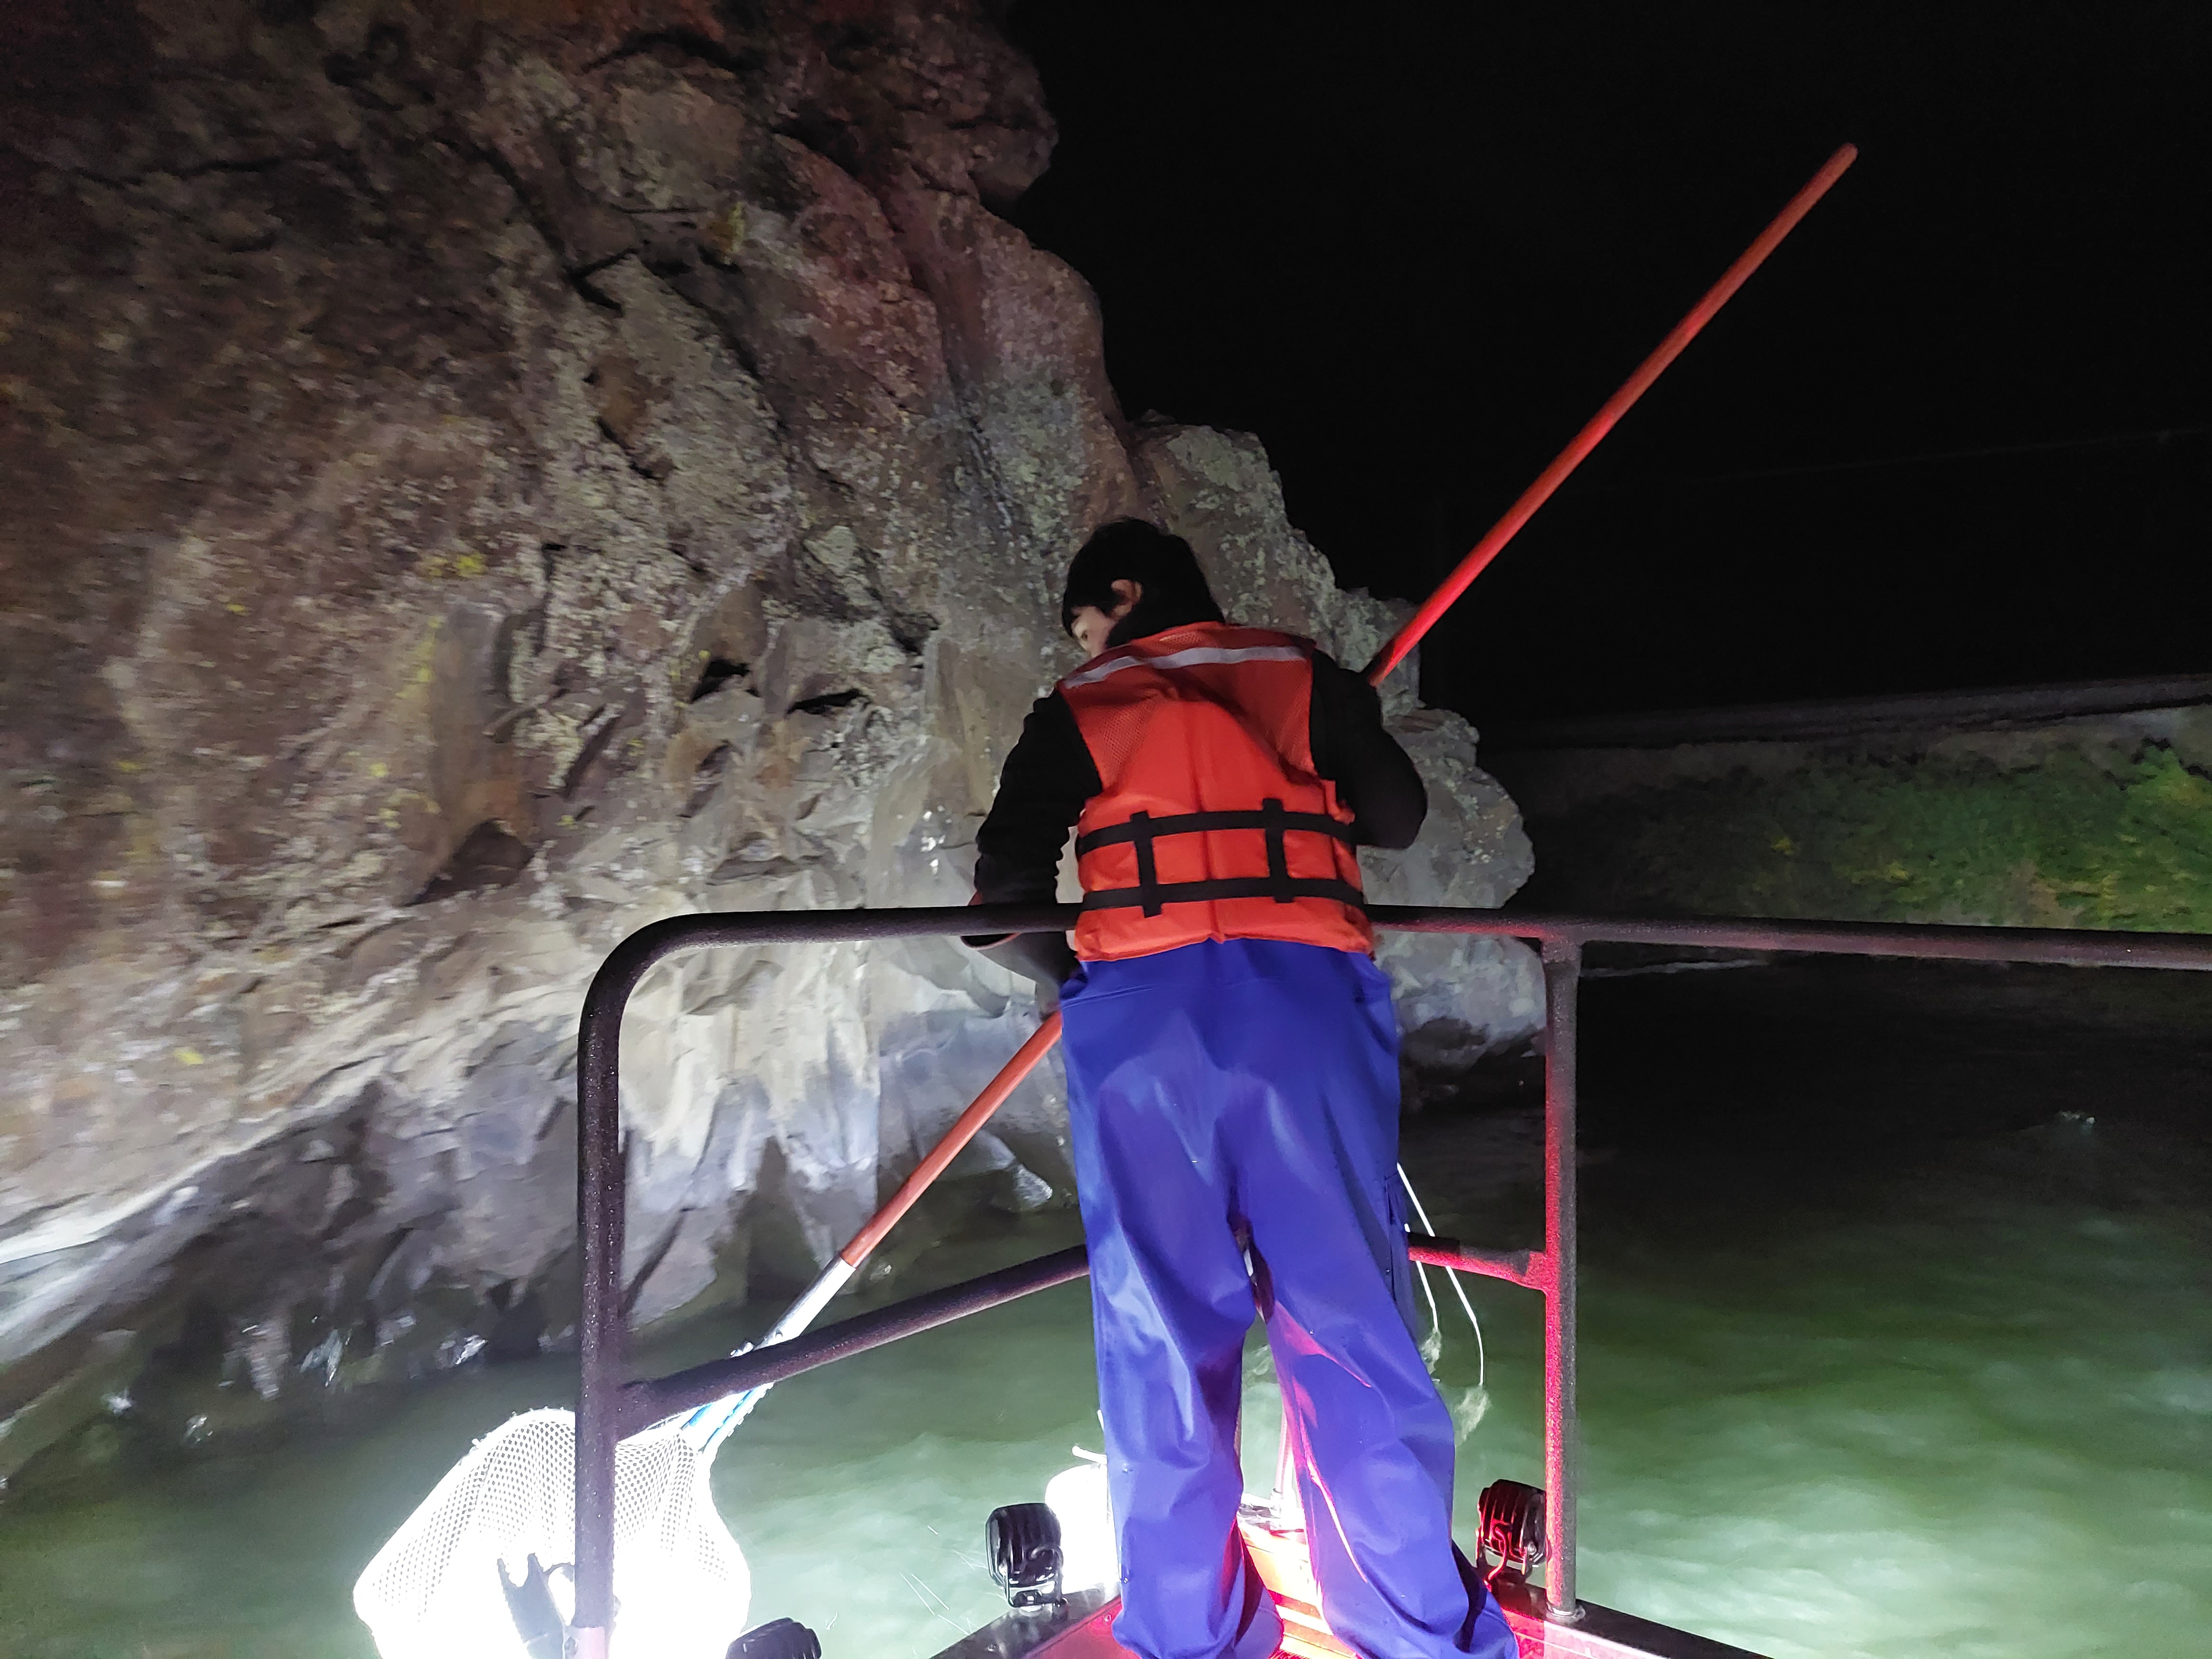
Electrofishing is easier at night with bright lights.
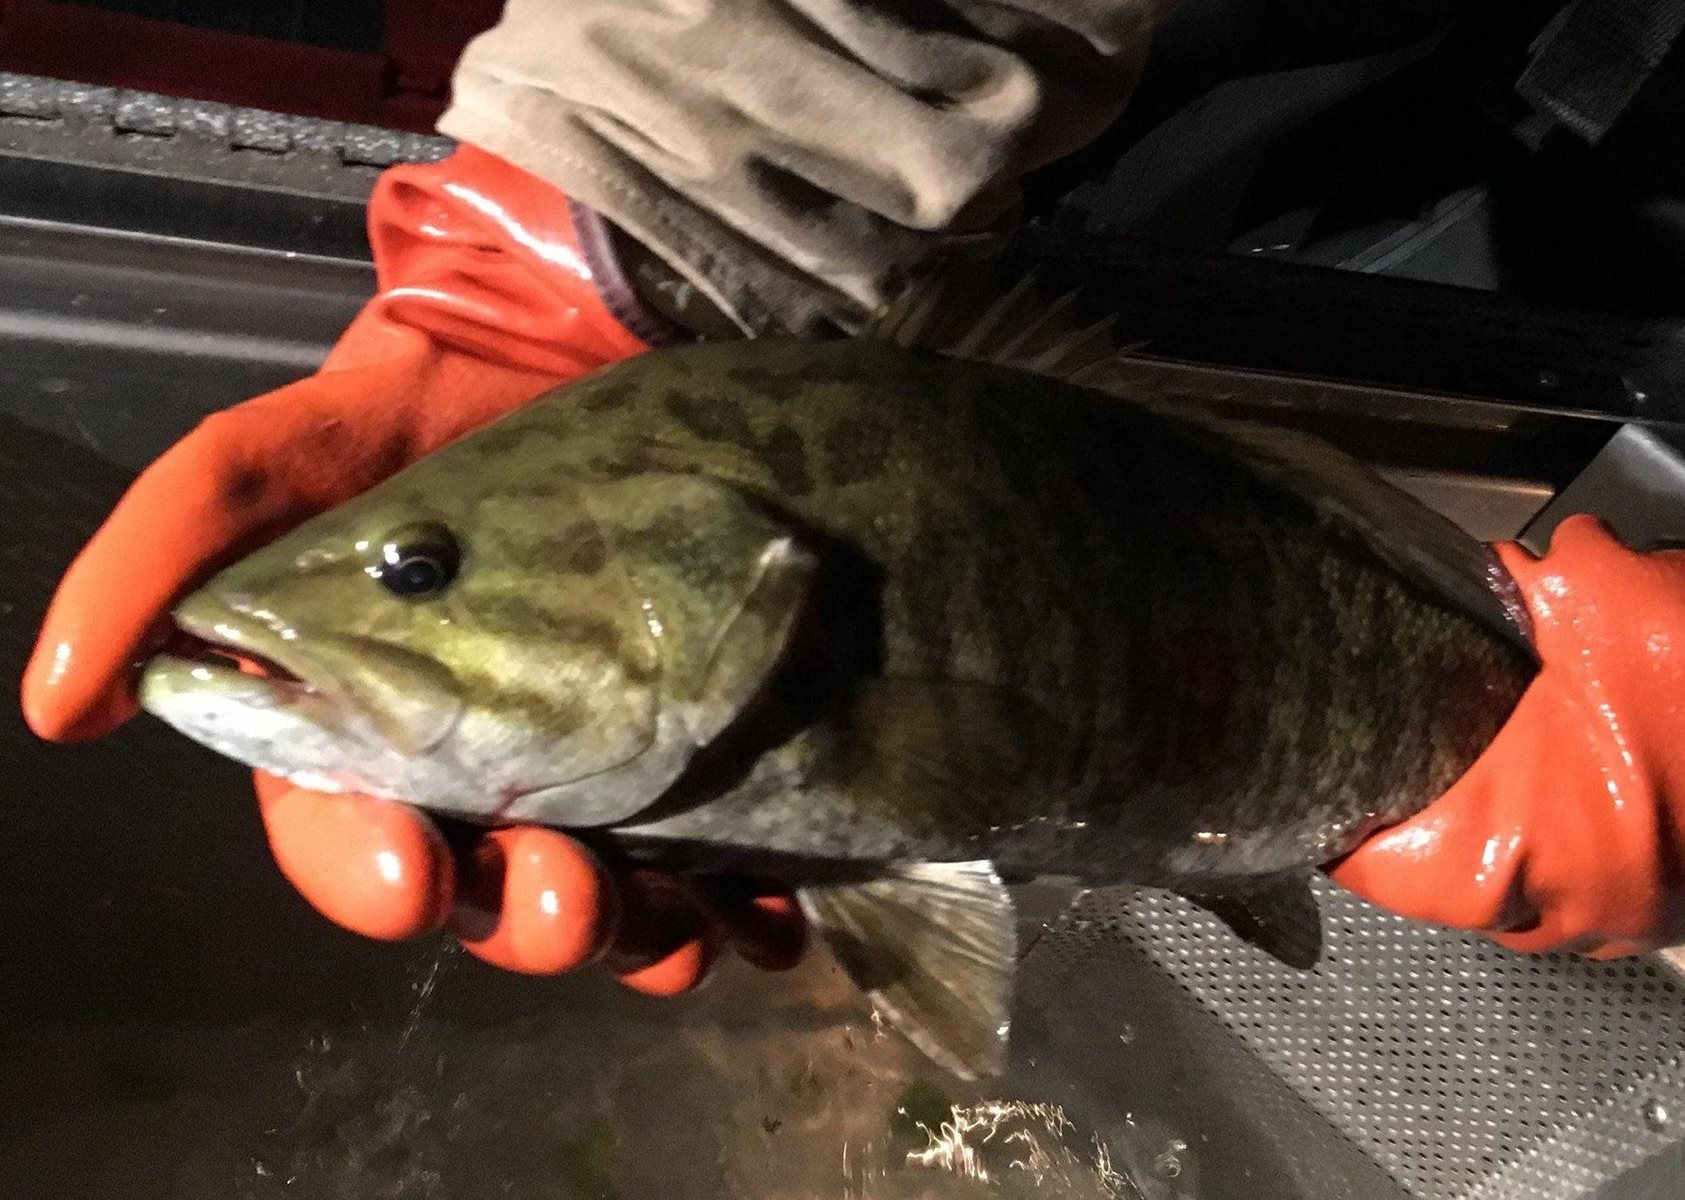
This smallmouth bass looks like a keeper.
Good eletrofishing conditions at Leland Lake.

Another beautiful morning at the office (Horsethief Lake 2023).

Our work day is just beginning at Lake McIntosh (2023).
Not every fish is a keeper. This largemouth bass was too big and was released.
Getting stuck in the weeds at Lake McIntosh.
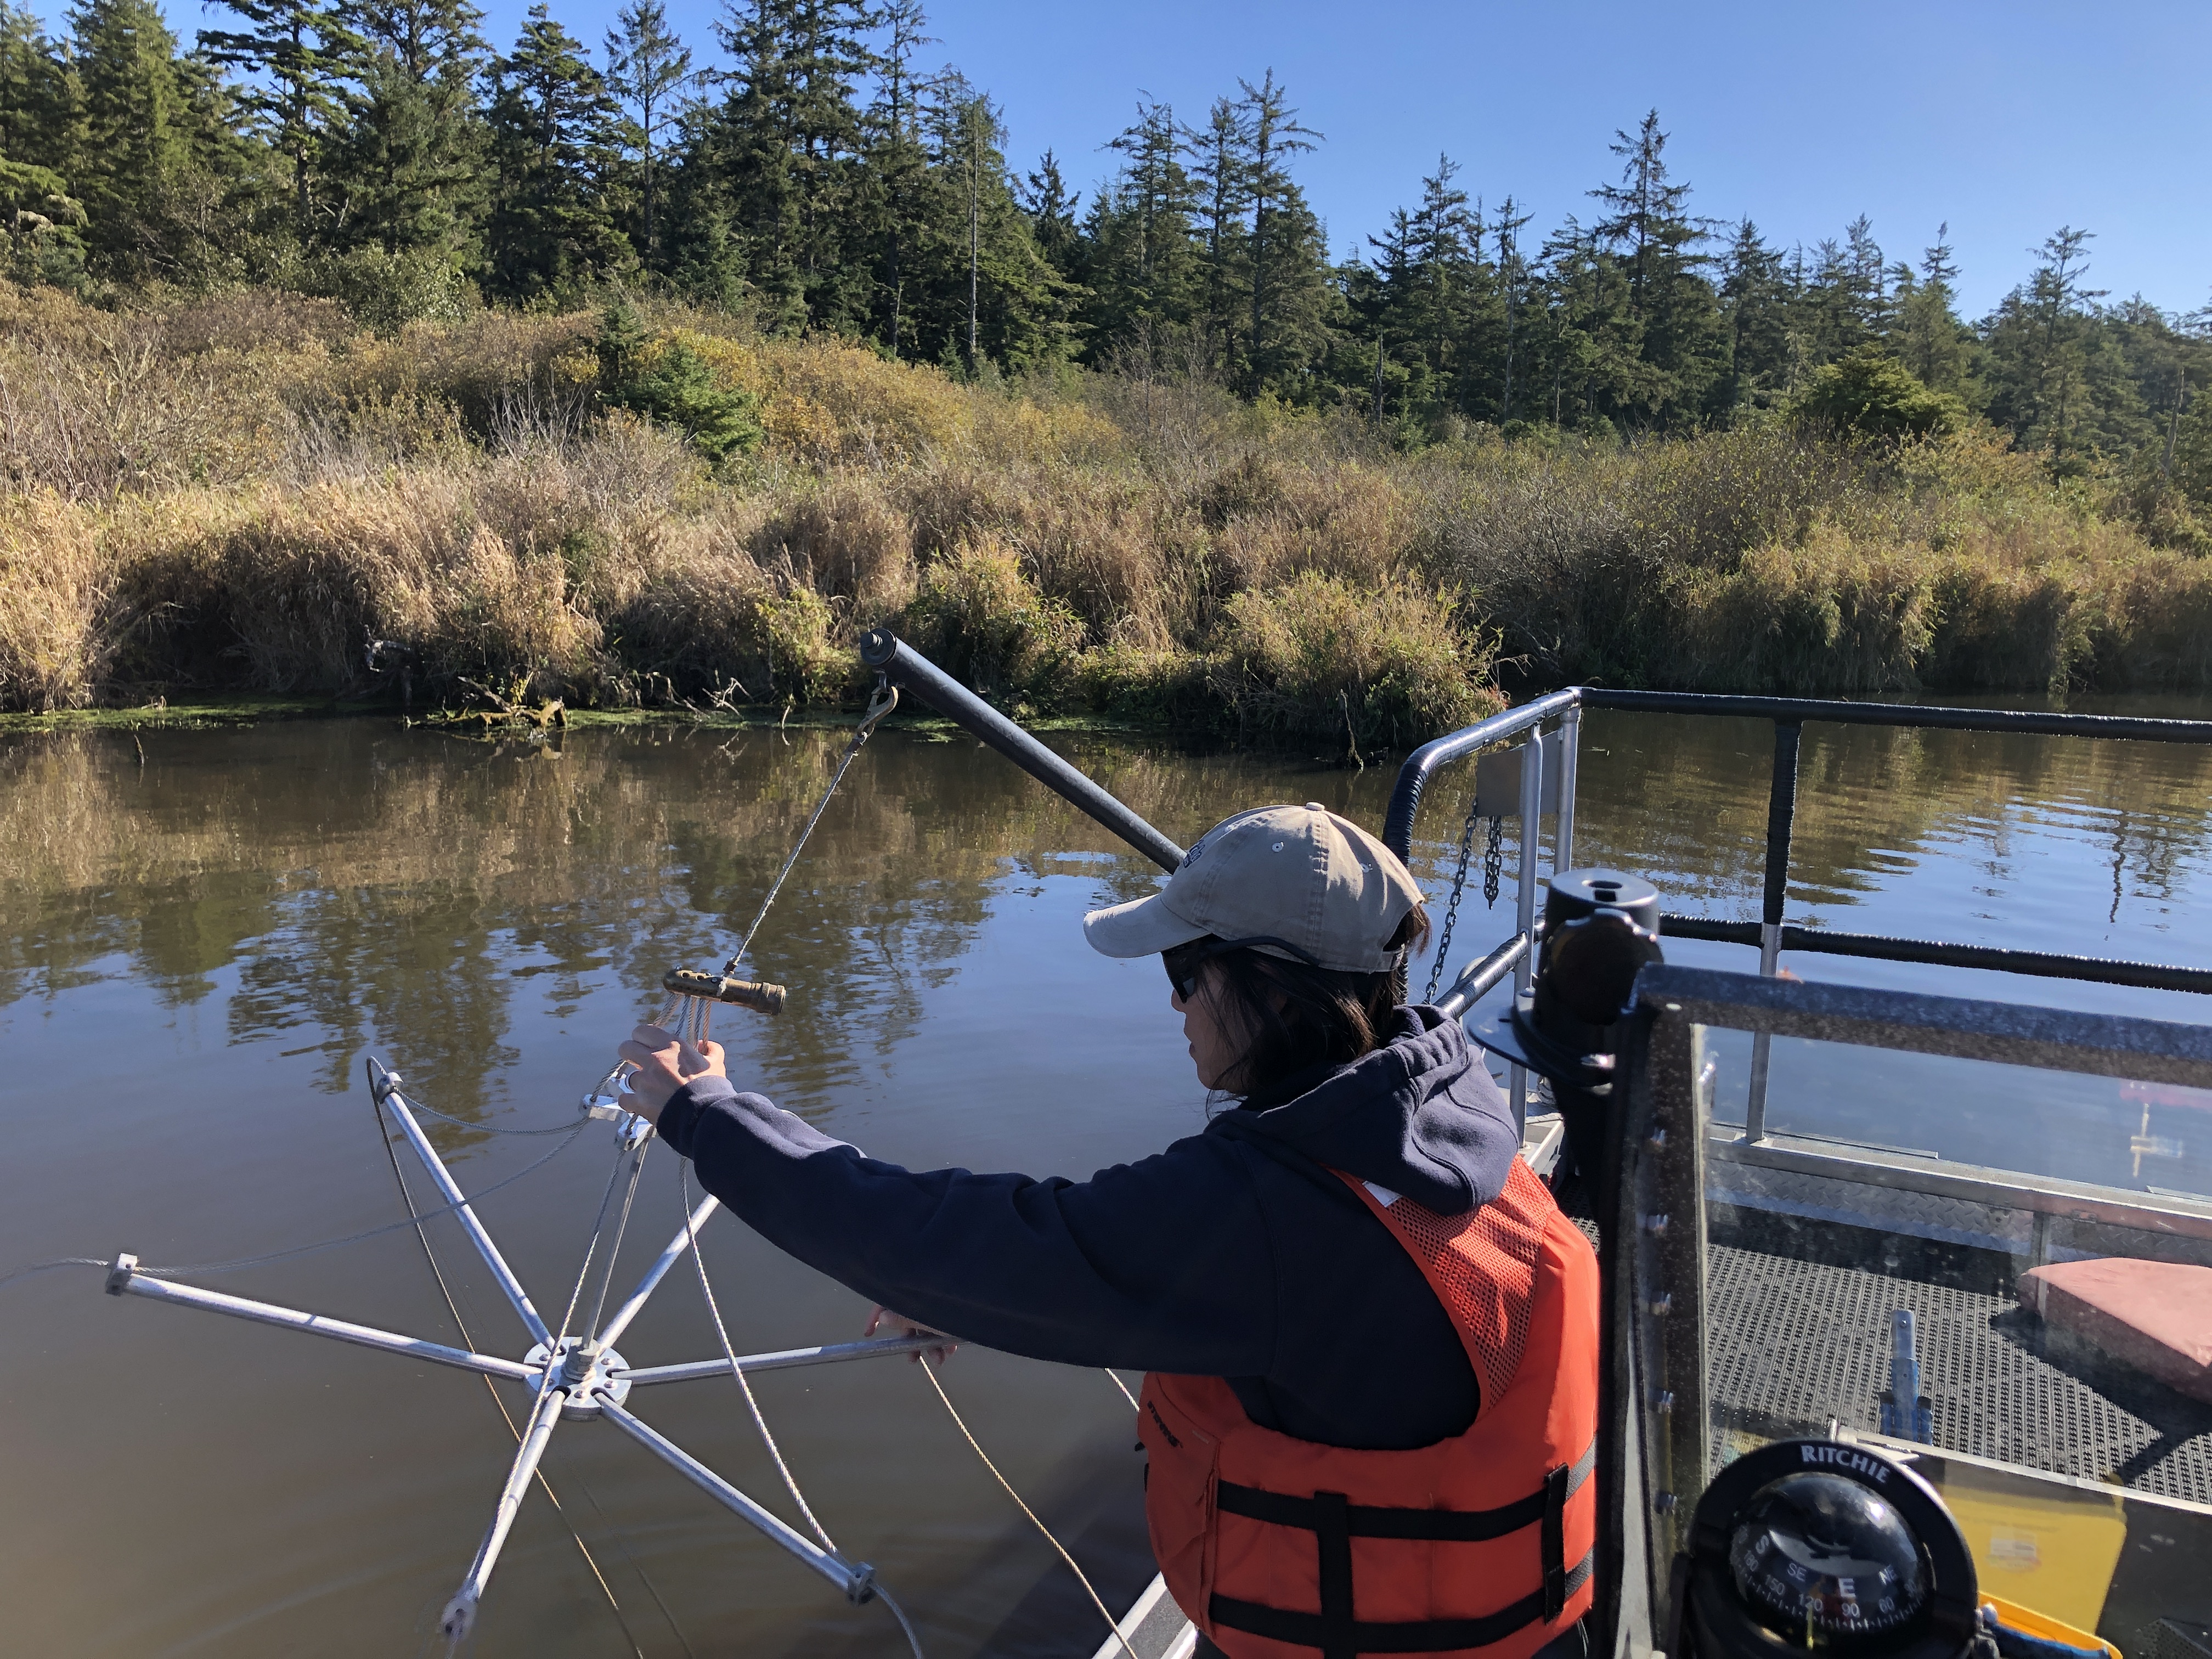
This might look like a broken umbrella, but the anode array is an important piece of our electrofishing equipment.
Knocking out a rainbow trout.
How we monitor mercury in fish
Collecting fish
Our collection period is in the fall, and we are often limited to one or two sampling events at each waterbody. To make sure we meet the goals for the study we collaborate with Washington Department of Fish and Wildlife and employ a few different collection methods on our own.


Our target fish
Every year, we collect 10 largemouth bass or smallmouth bass from six of the 30 monitored waterbodies. We generally look for bass that range between 200-450 mm, which accounts for the mercury-size relationship that is characteristic of bioaccumulative toxics. Flip through the photos at the bottom of the page to see the fish that we catch for this study. We end each fishing period with 60 individual bass samples that are analyzed for mercury.
Additional fish sampling
We try to collect up to two additional, or ancillary, species per waterbody that represent popular sport or subsistence catch. We collect up to 15 fish for each ancillary species, combine them by size into several composite samples, and analyze these composites for mercury.
We identify the fish we observe by species and record a general estimate of their numbers. We process fish that meet our project needs according to our standard operating procedure (SOP) for field fish collection.
The fish we collect
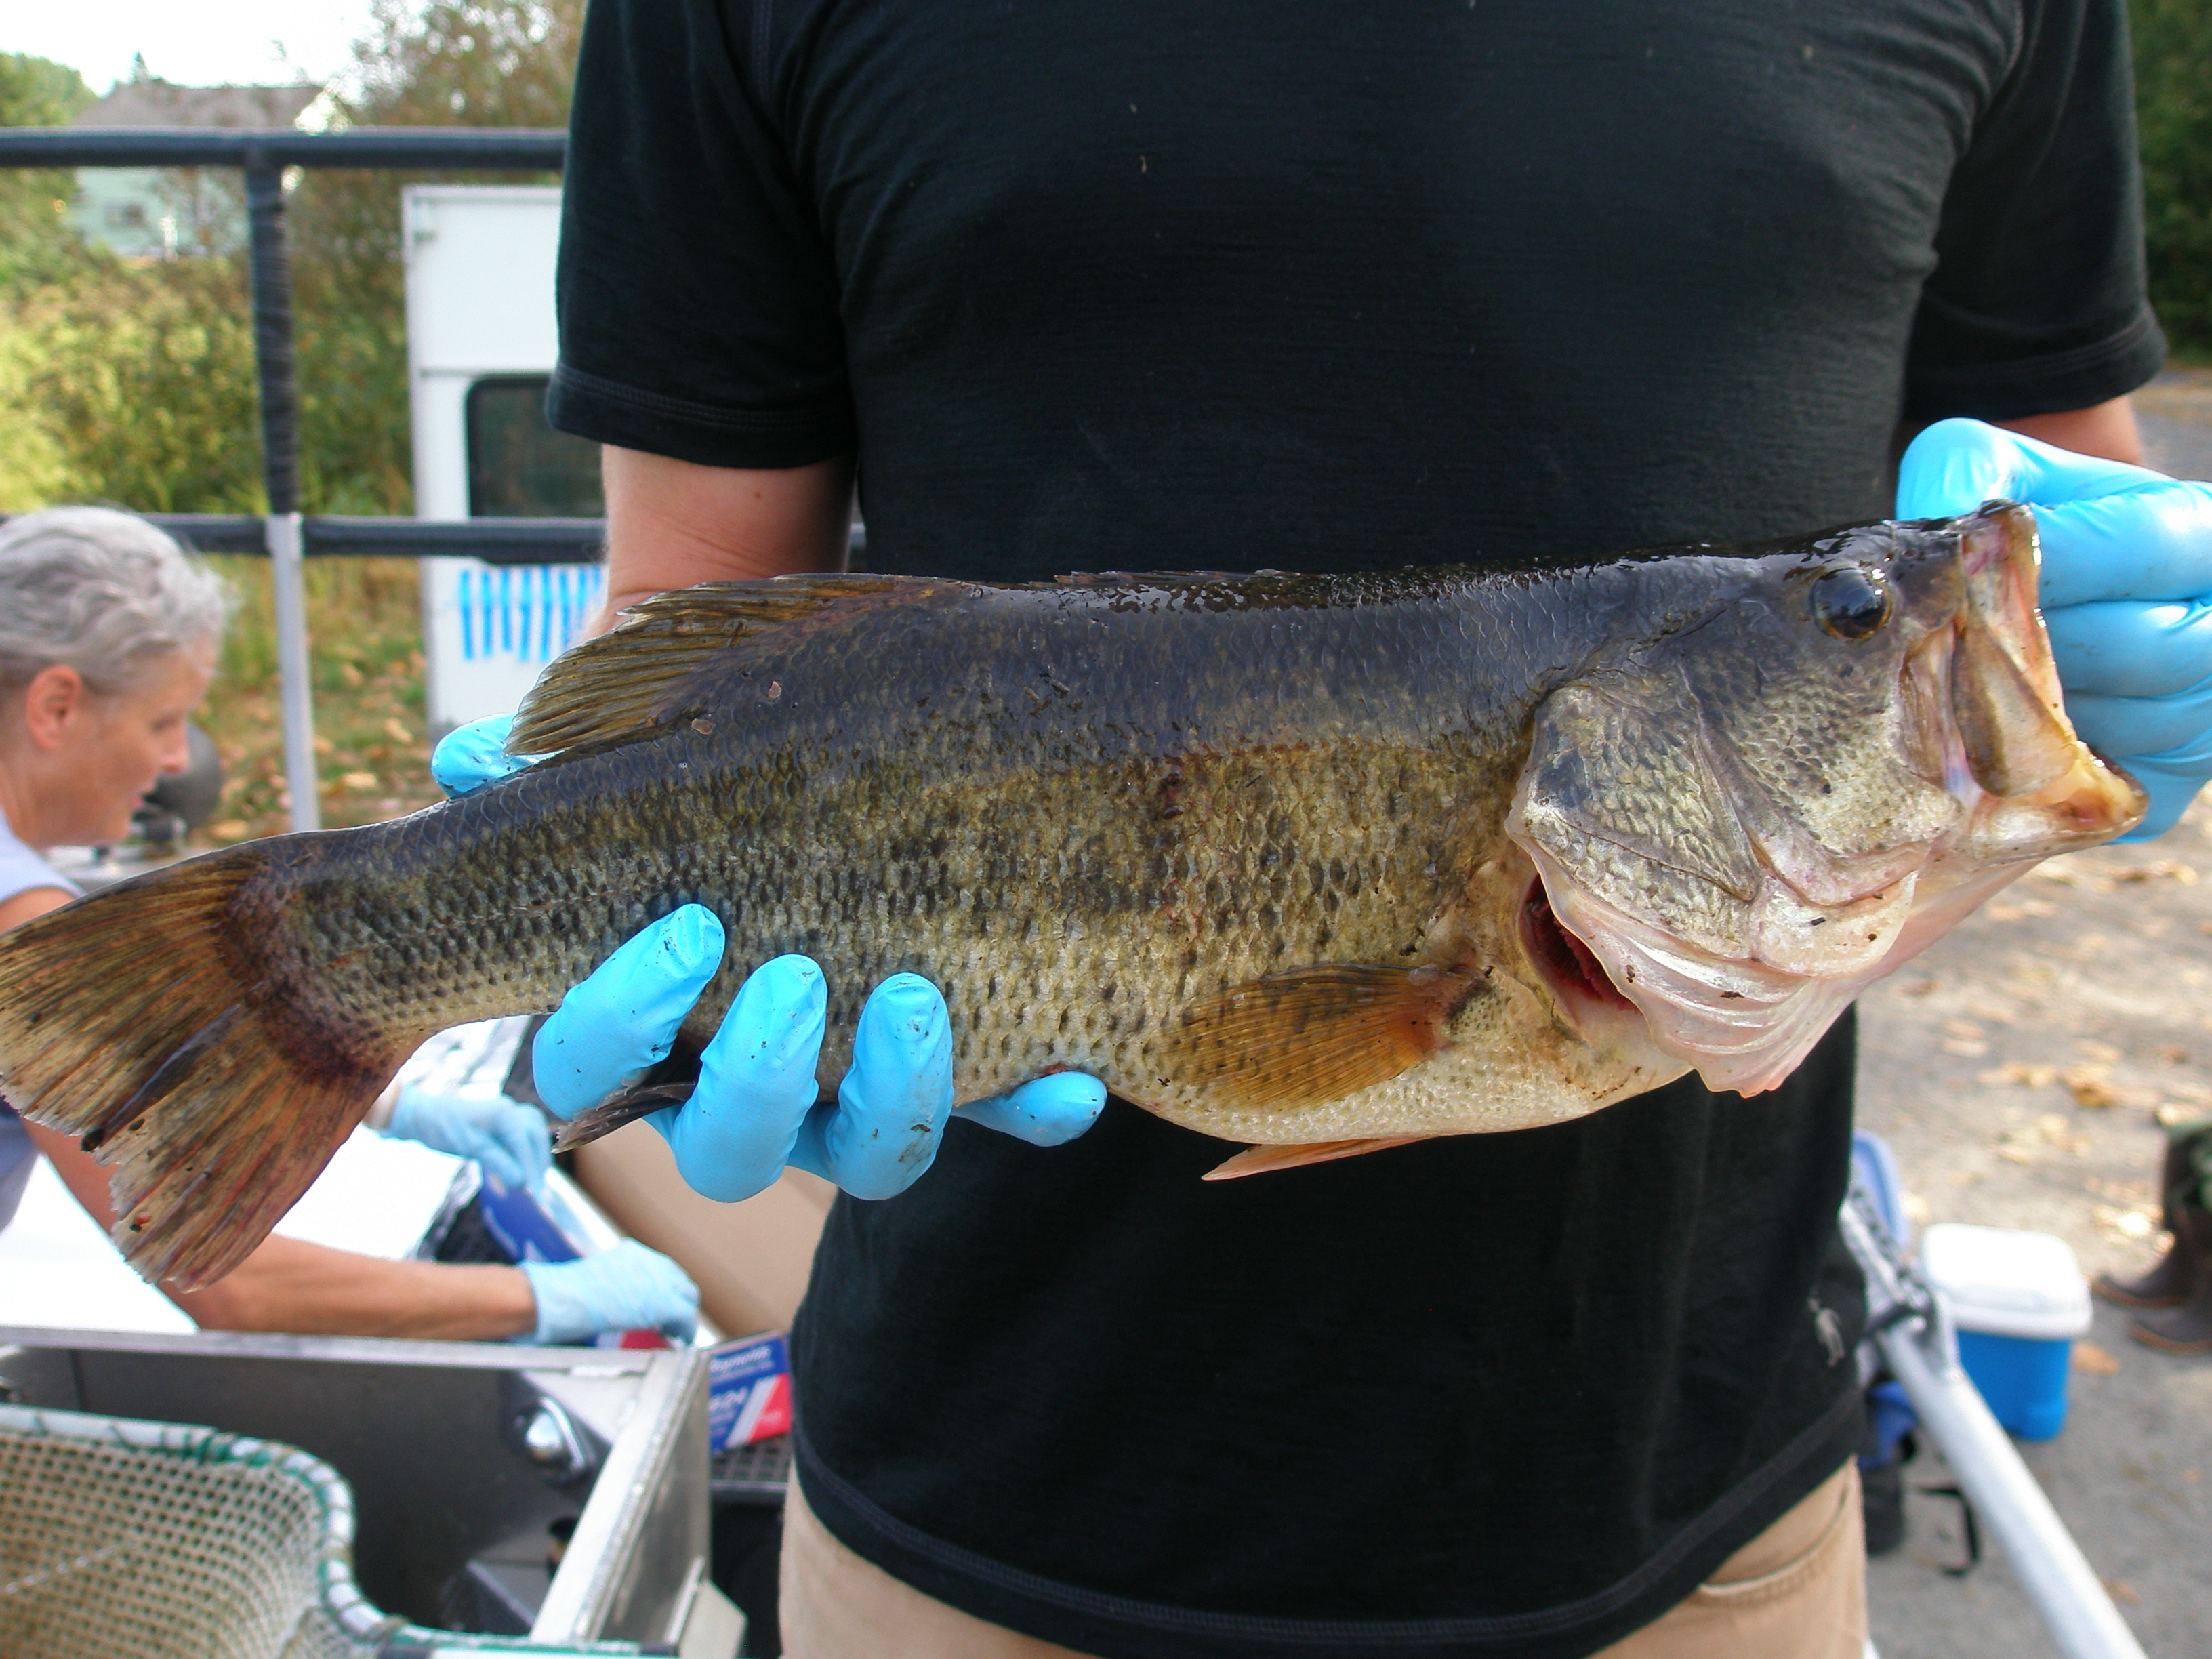
Largemouth bass (M. salmoides)
Smallmouth bass (M. dolomieu)
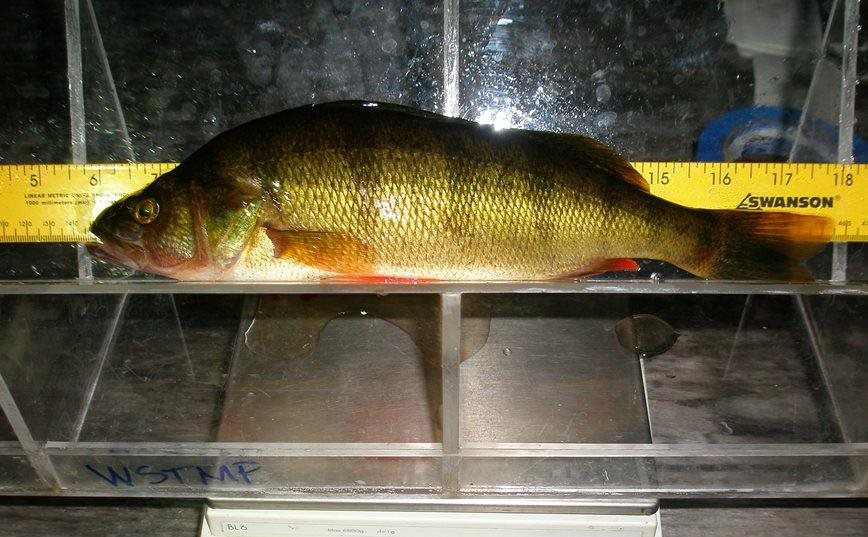
Yellow perch (P. flavescens)
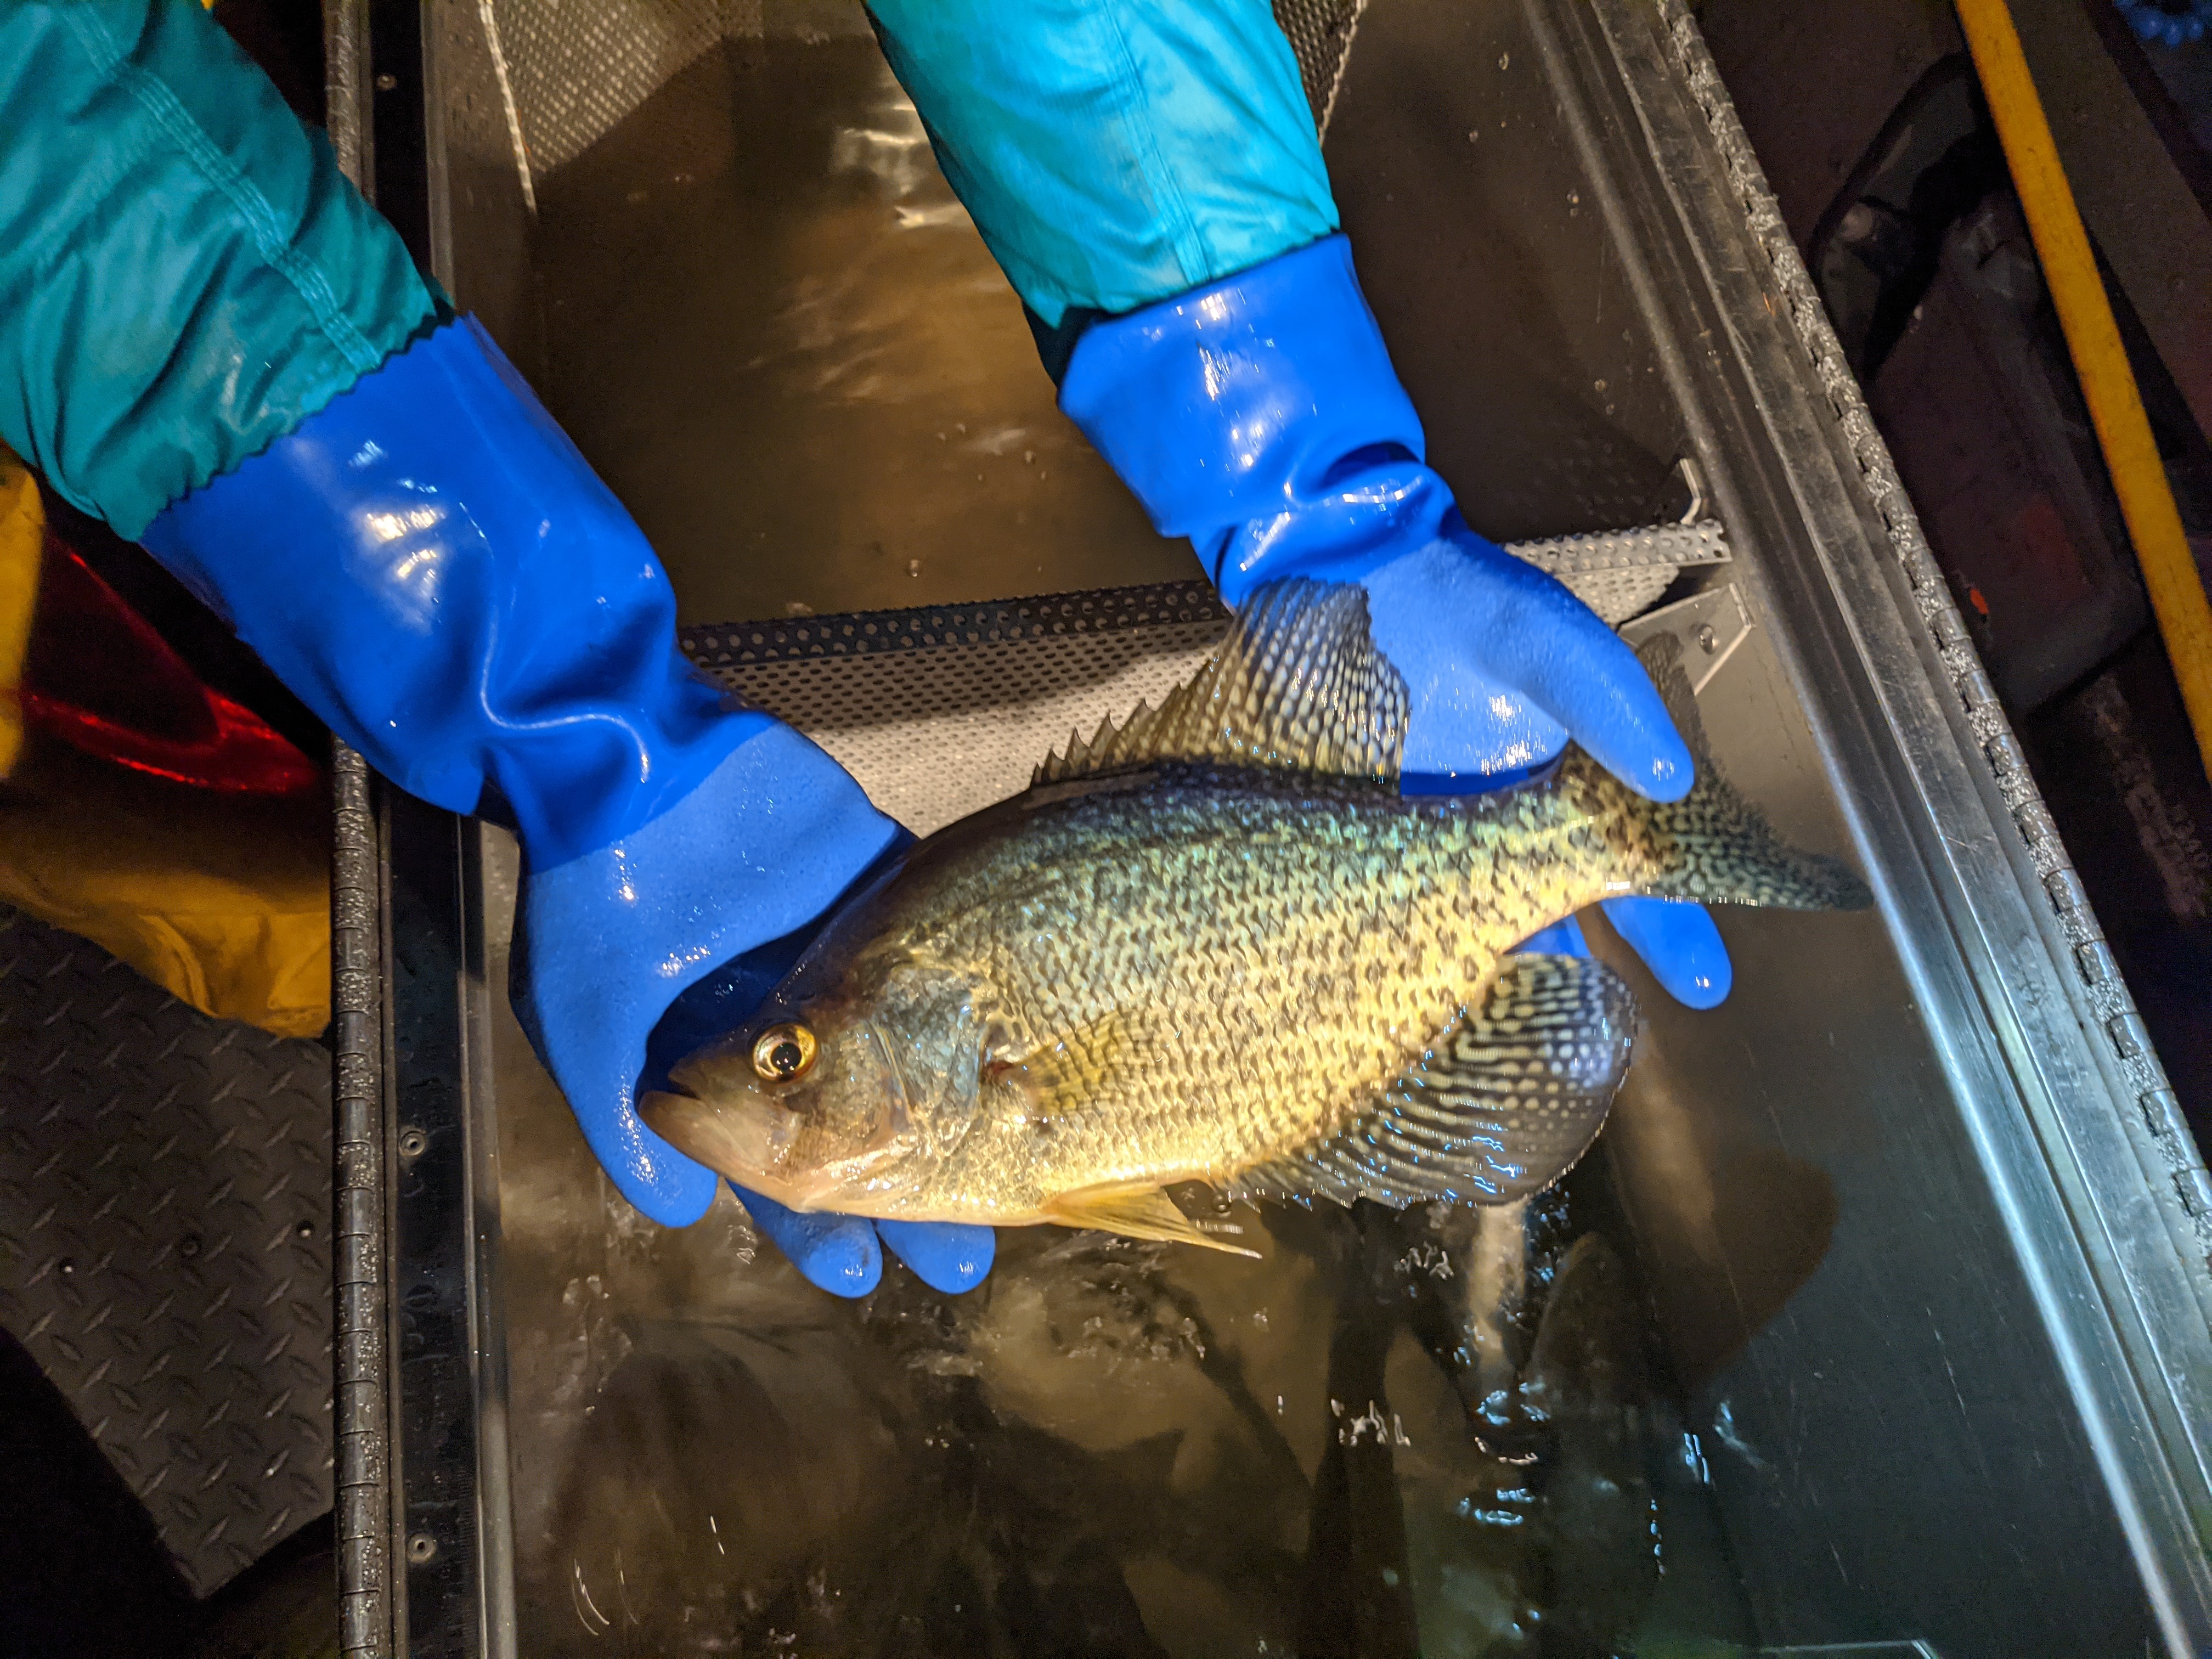
Black crappie (P. nigromaculatus)
Bluegill (L. macrochirus)
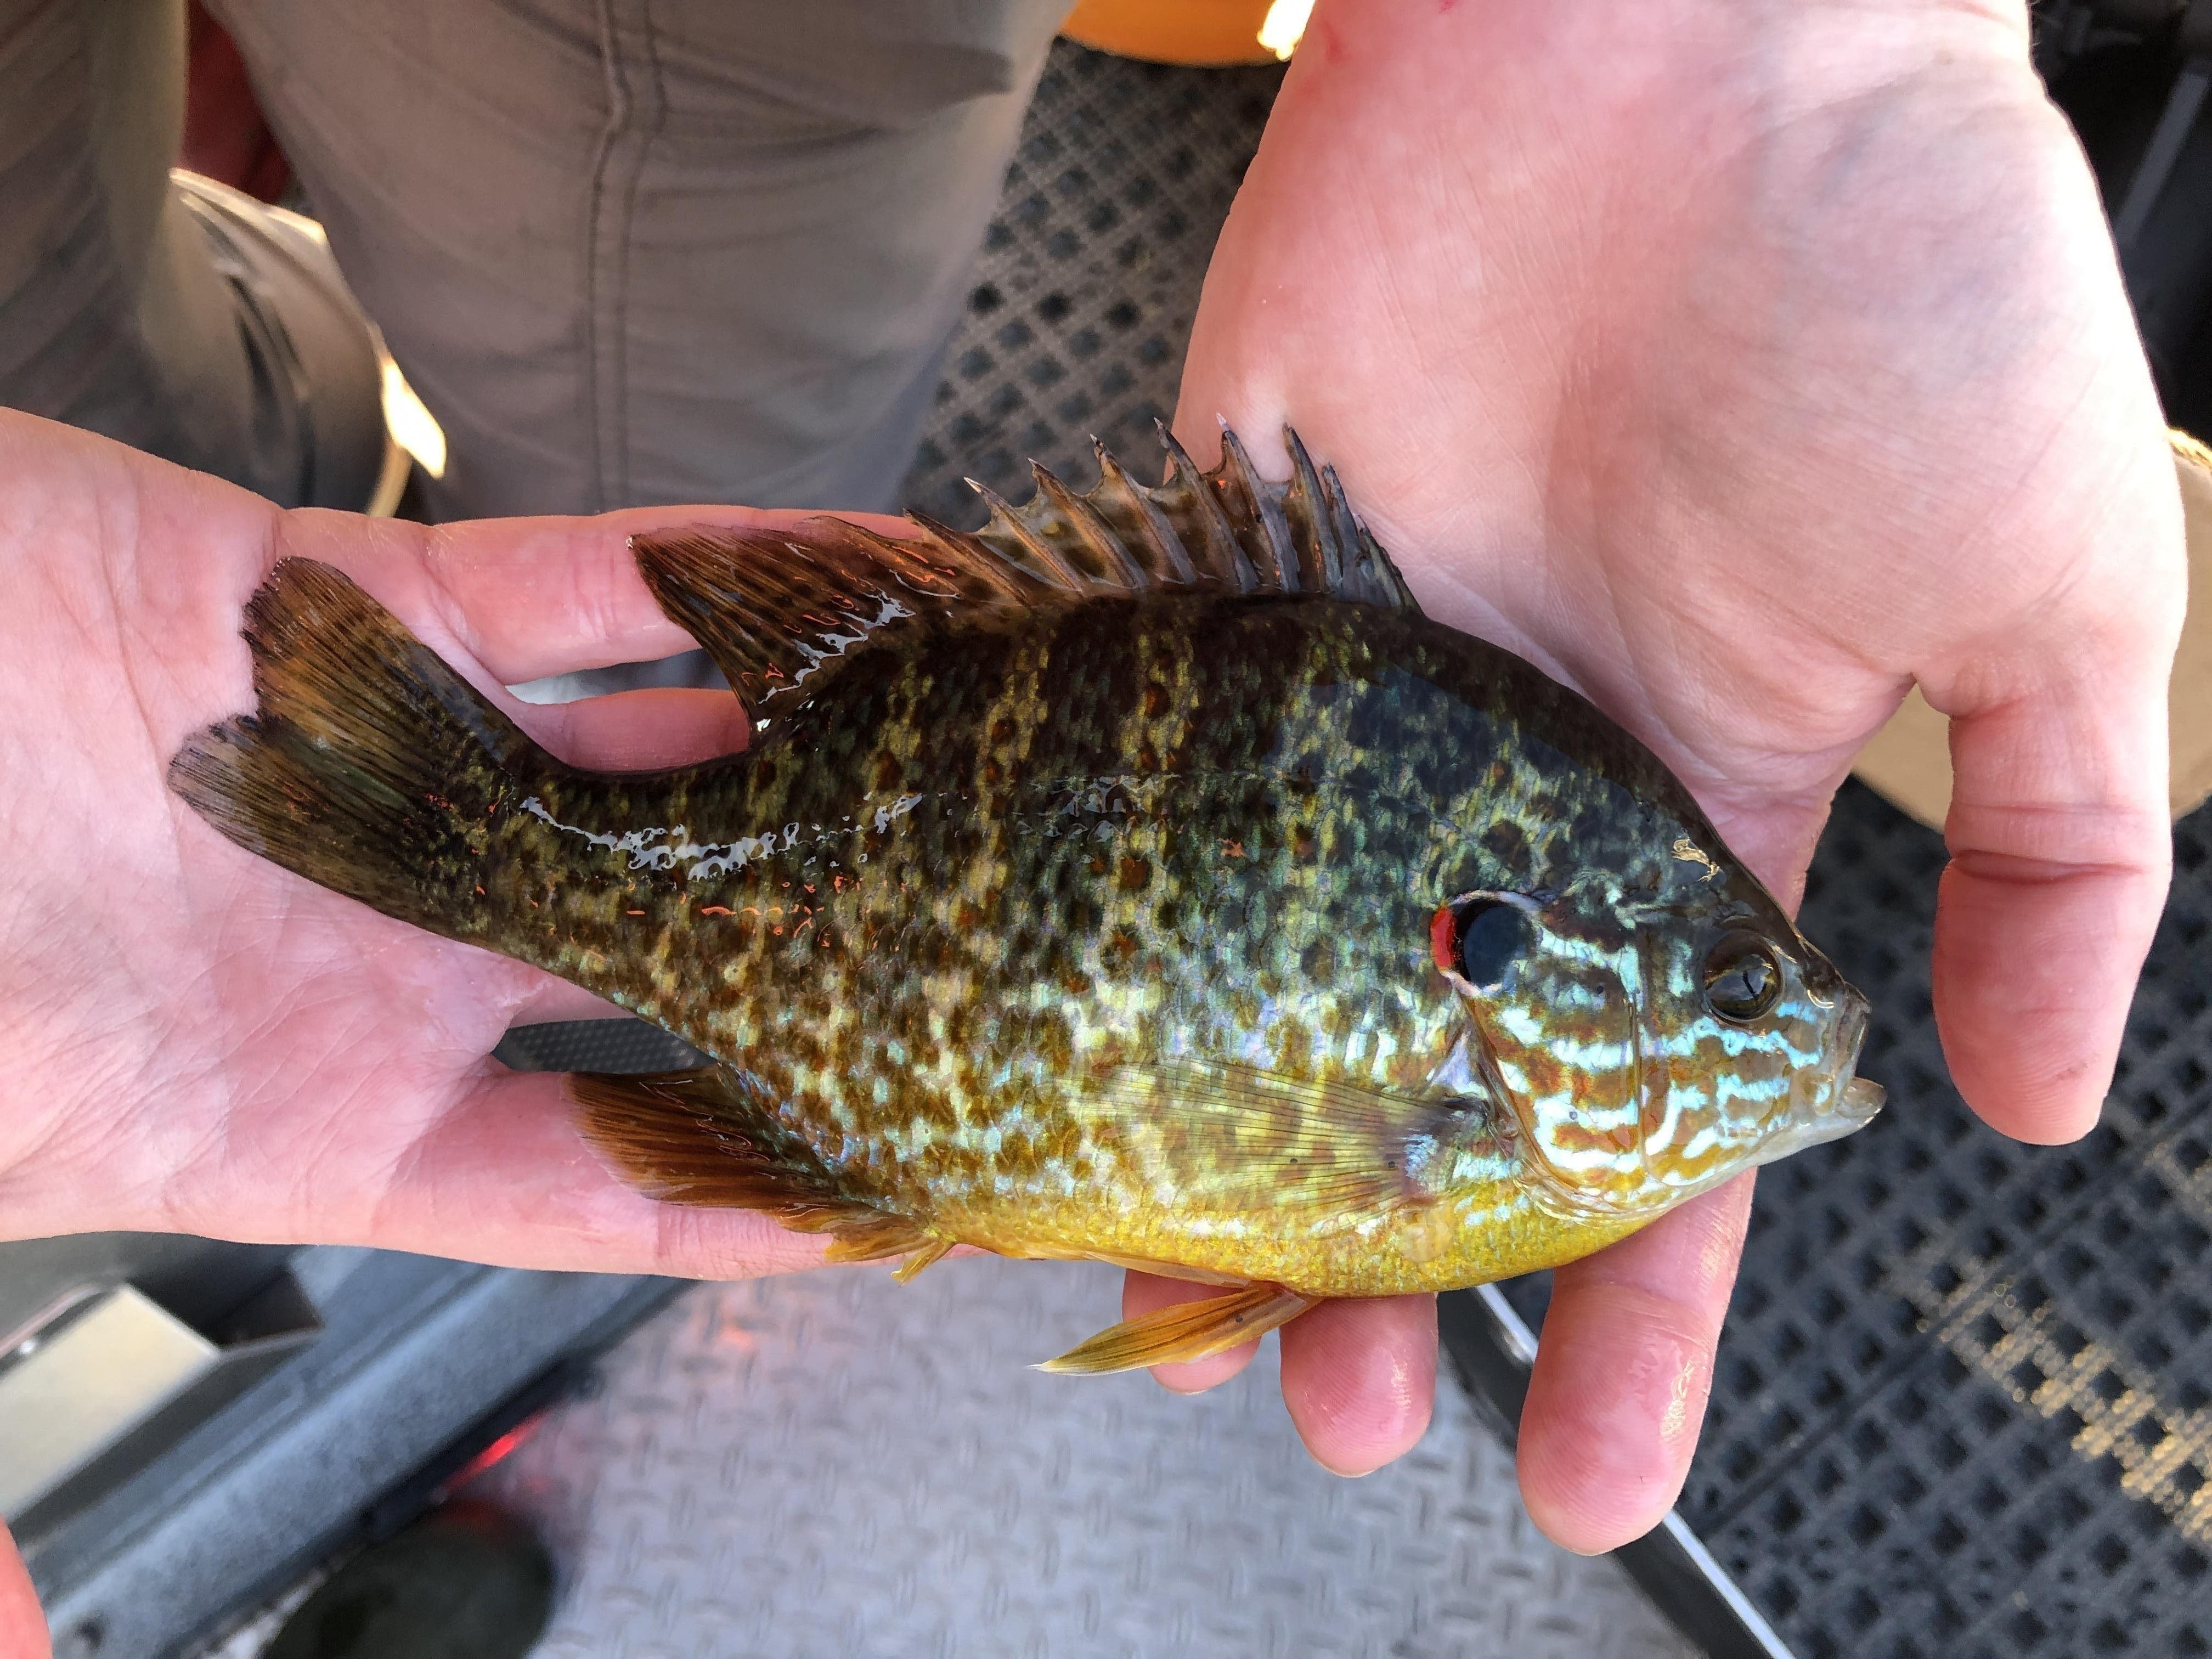
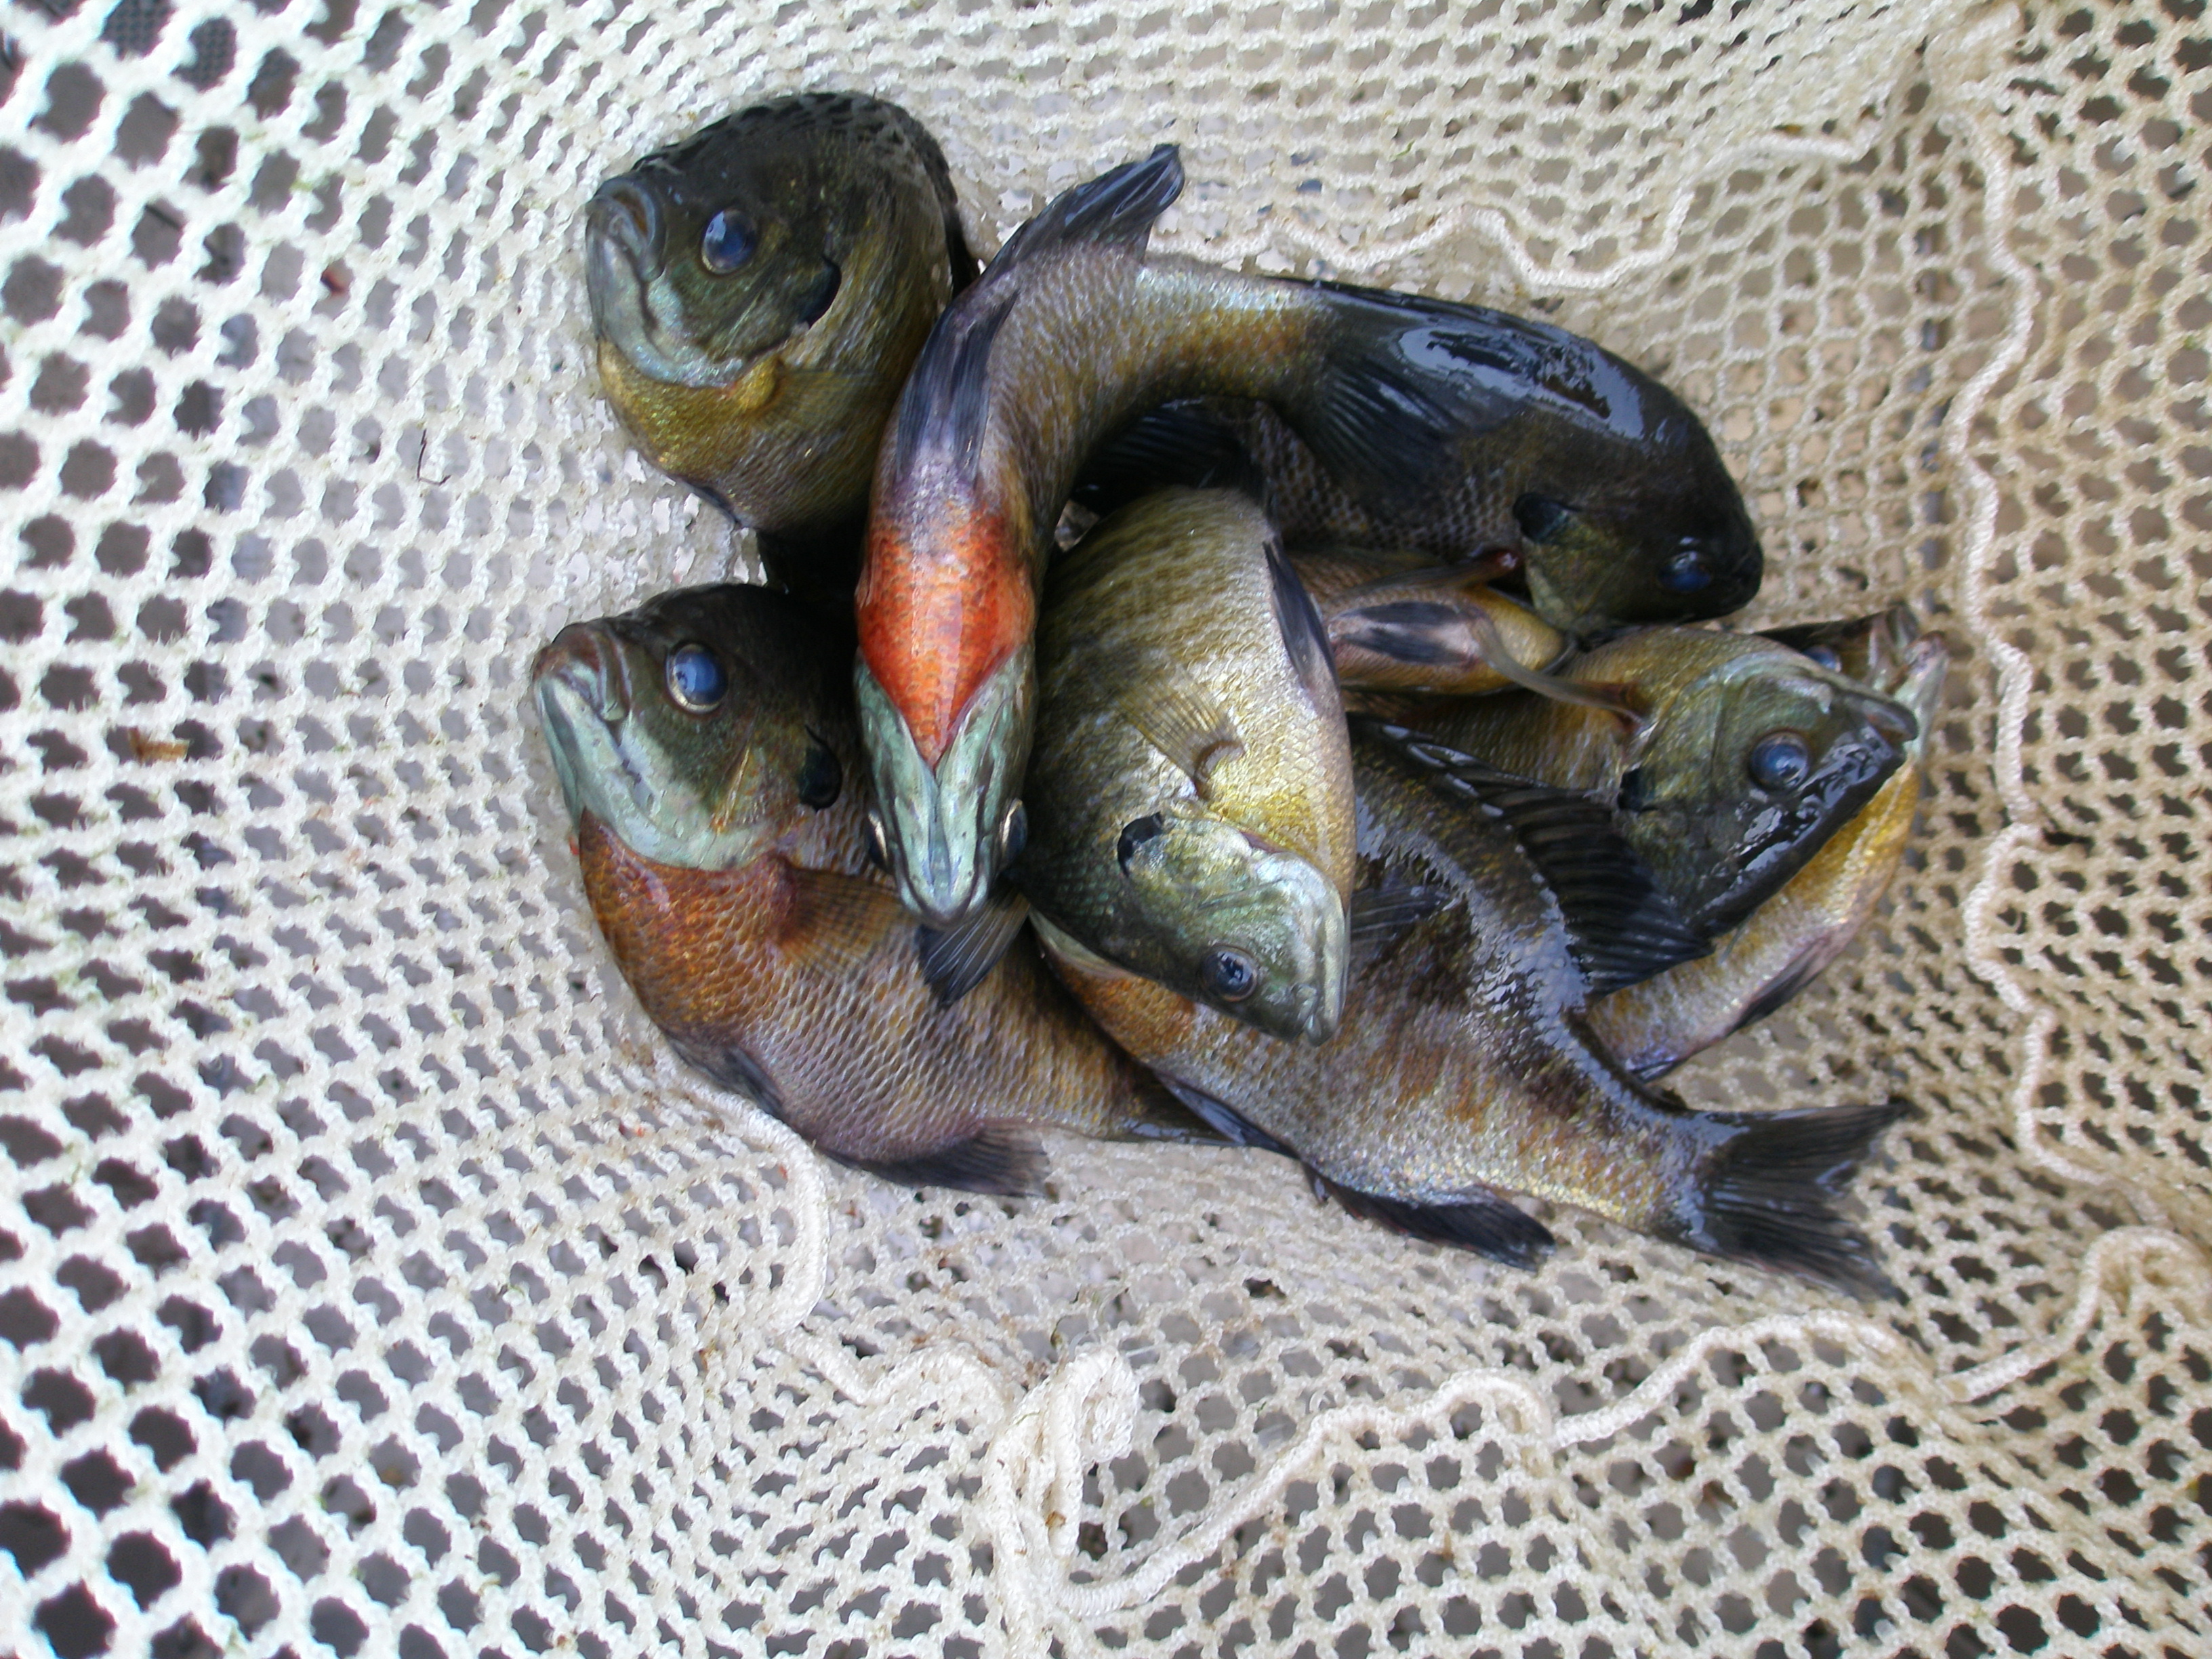
Pumpkinseed (L. gibbosus)
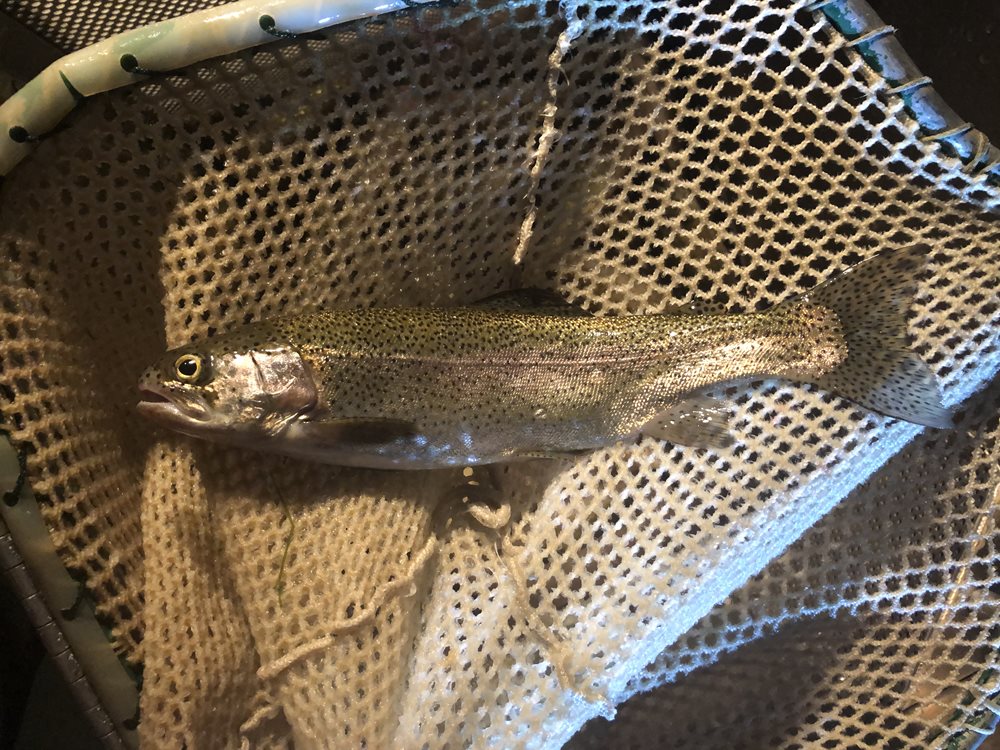
Rainbow trout (O. mykiss)
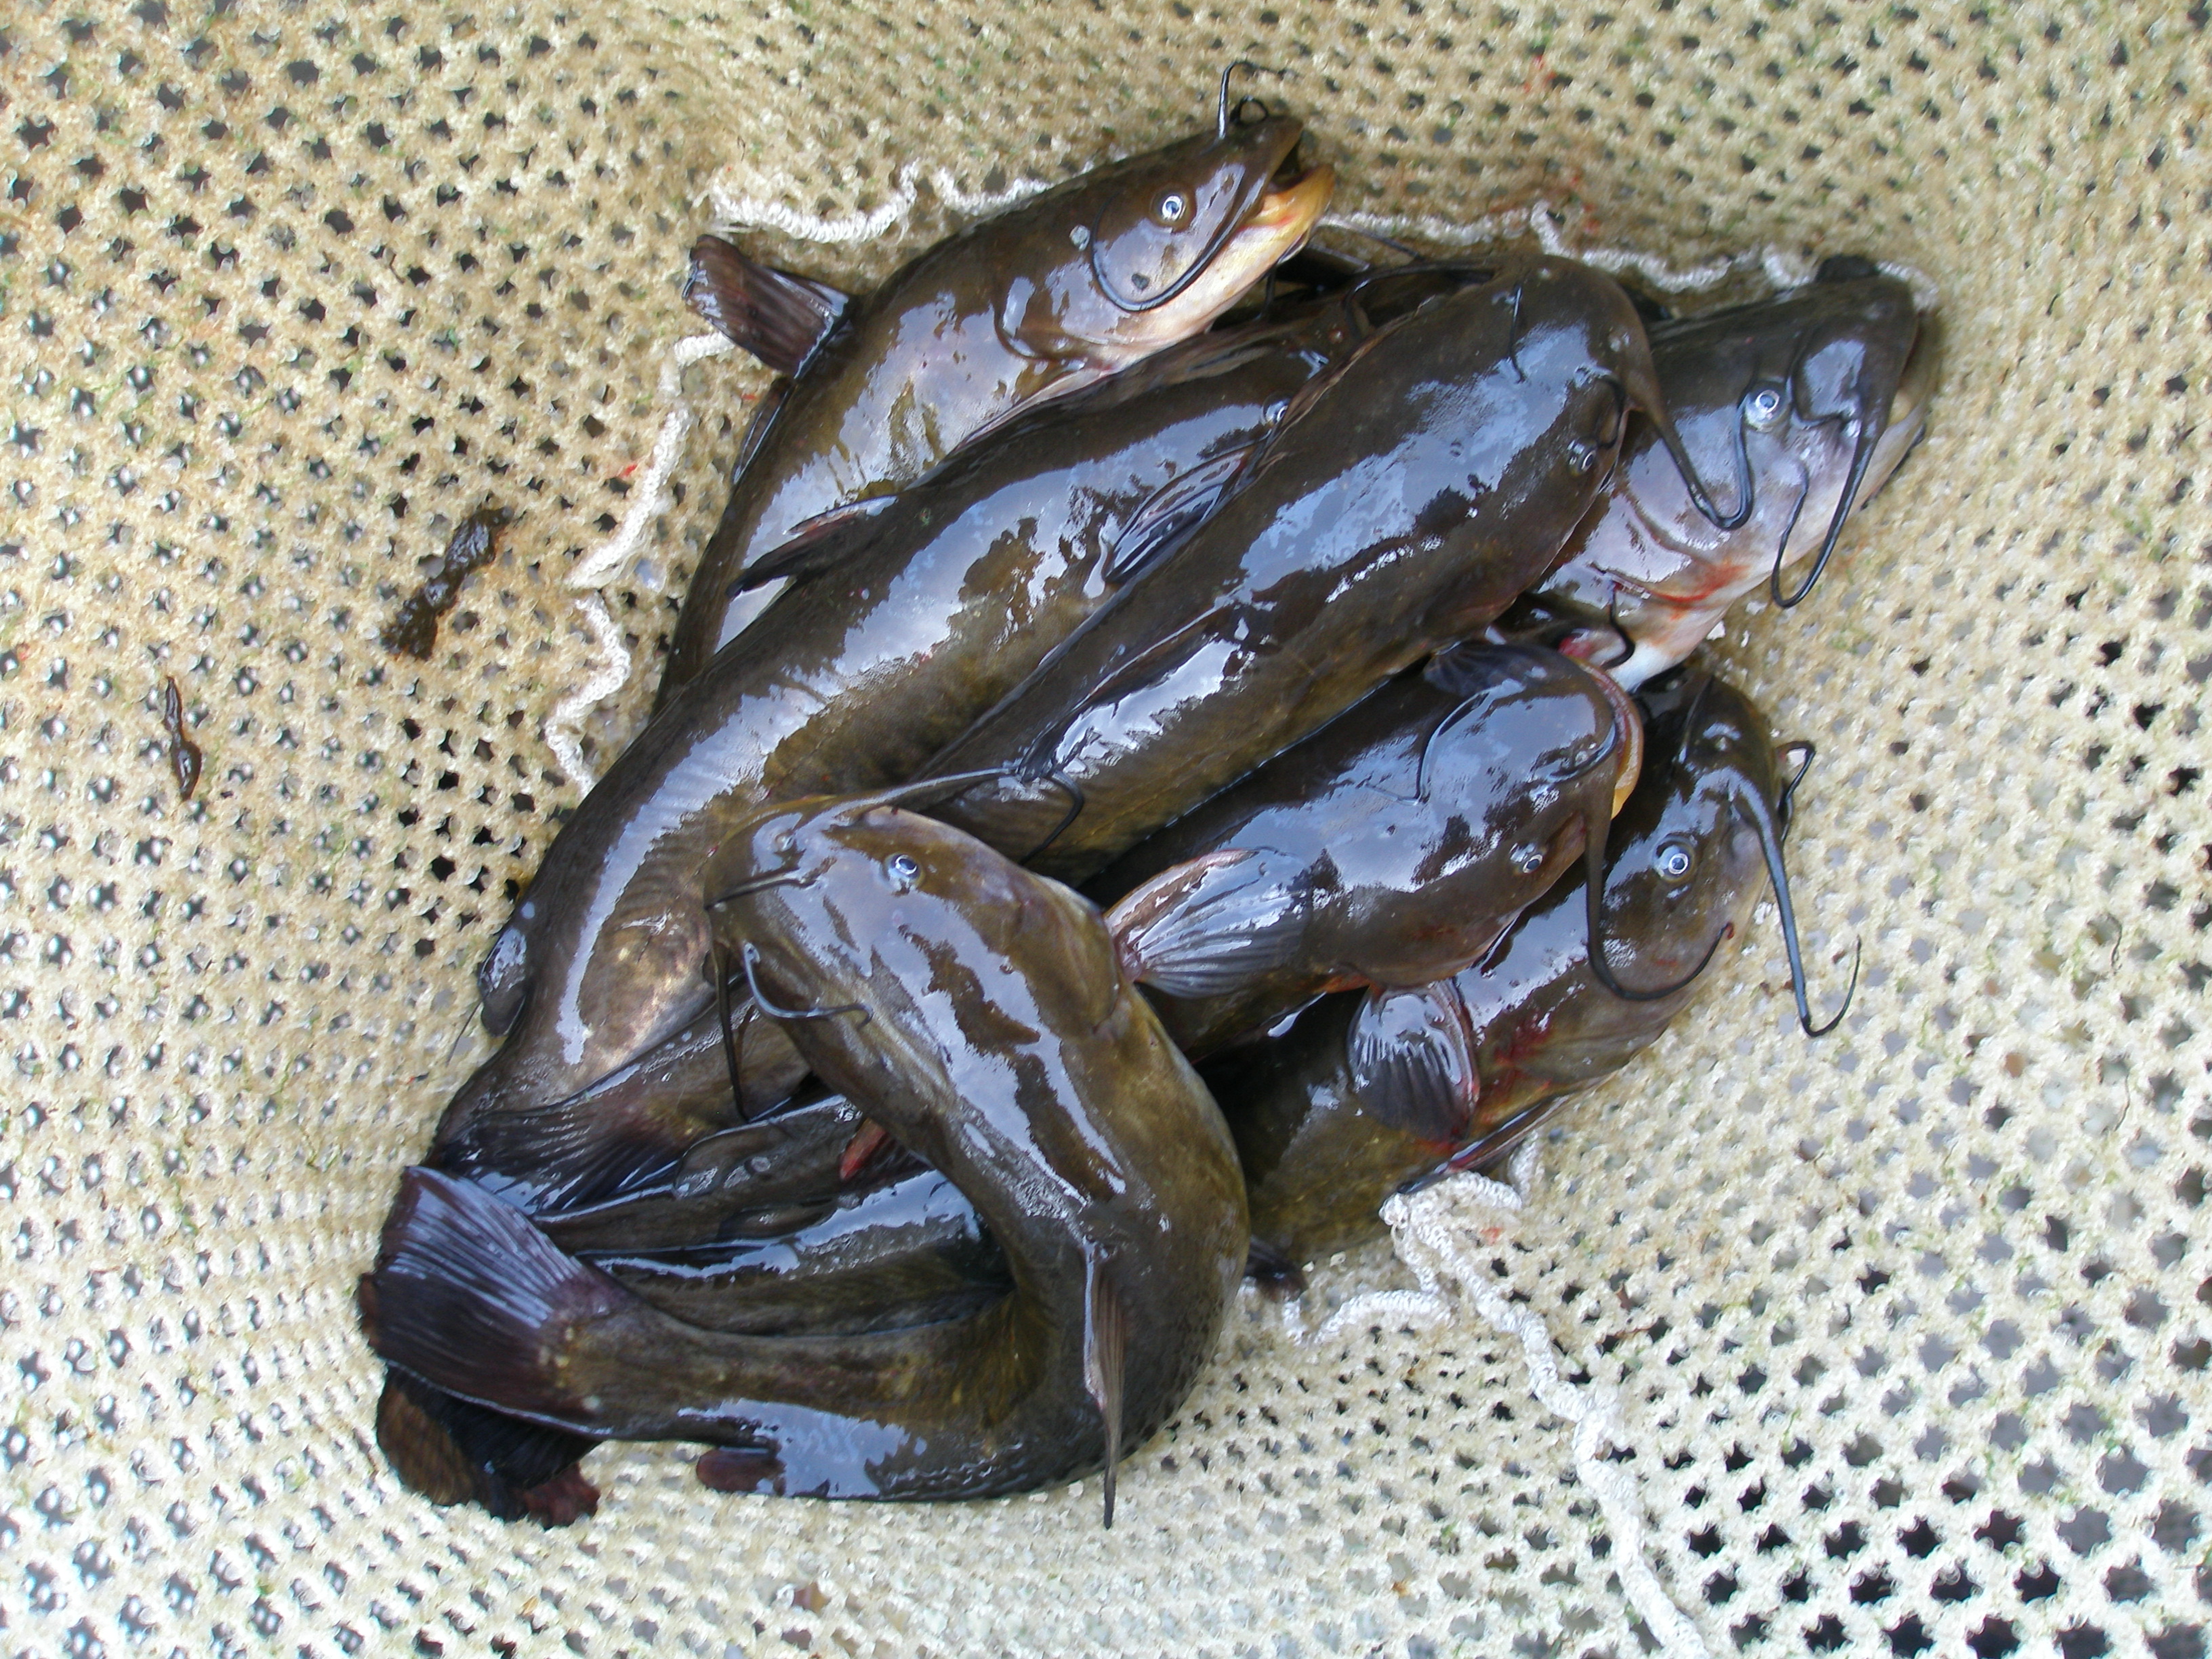
Brown bullhead (A. nebulosus)
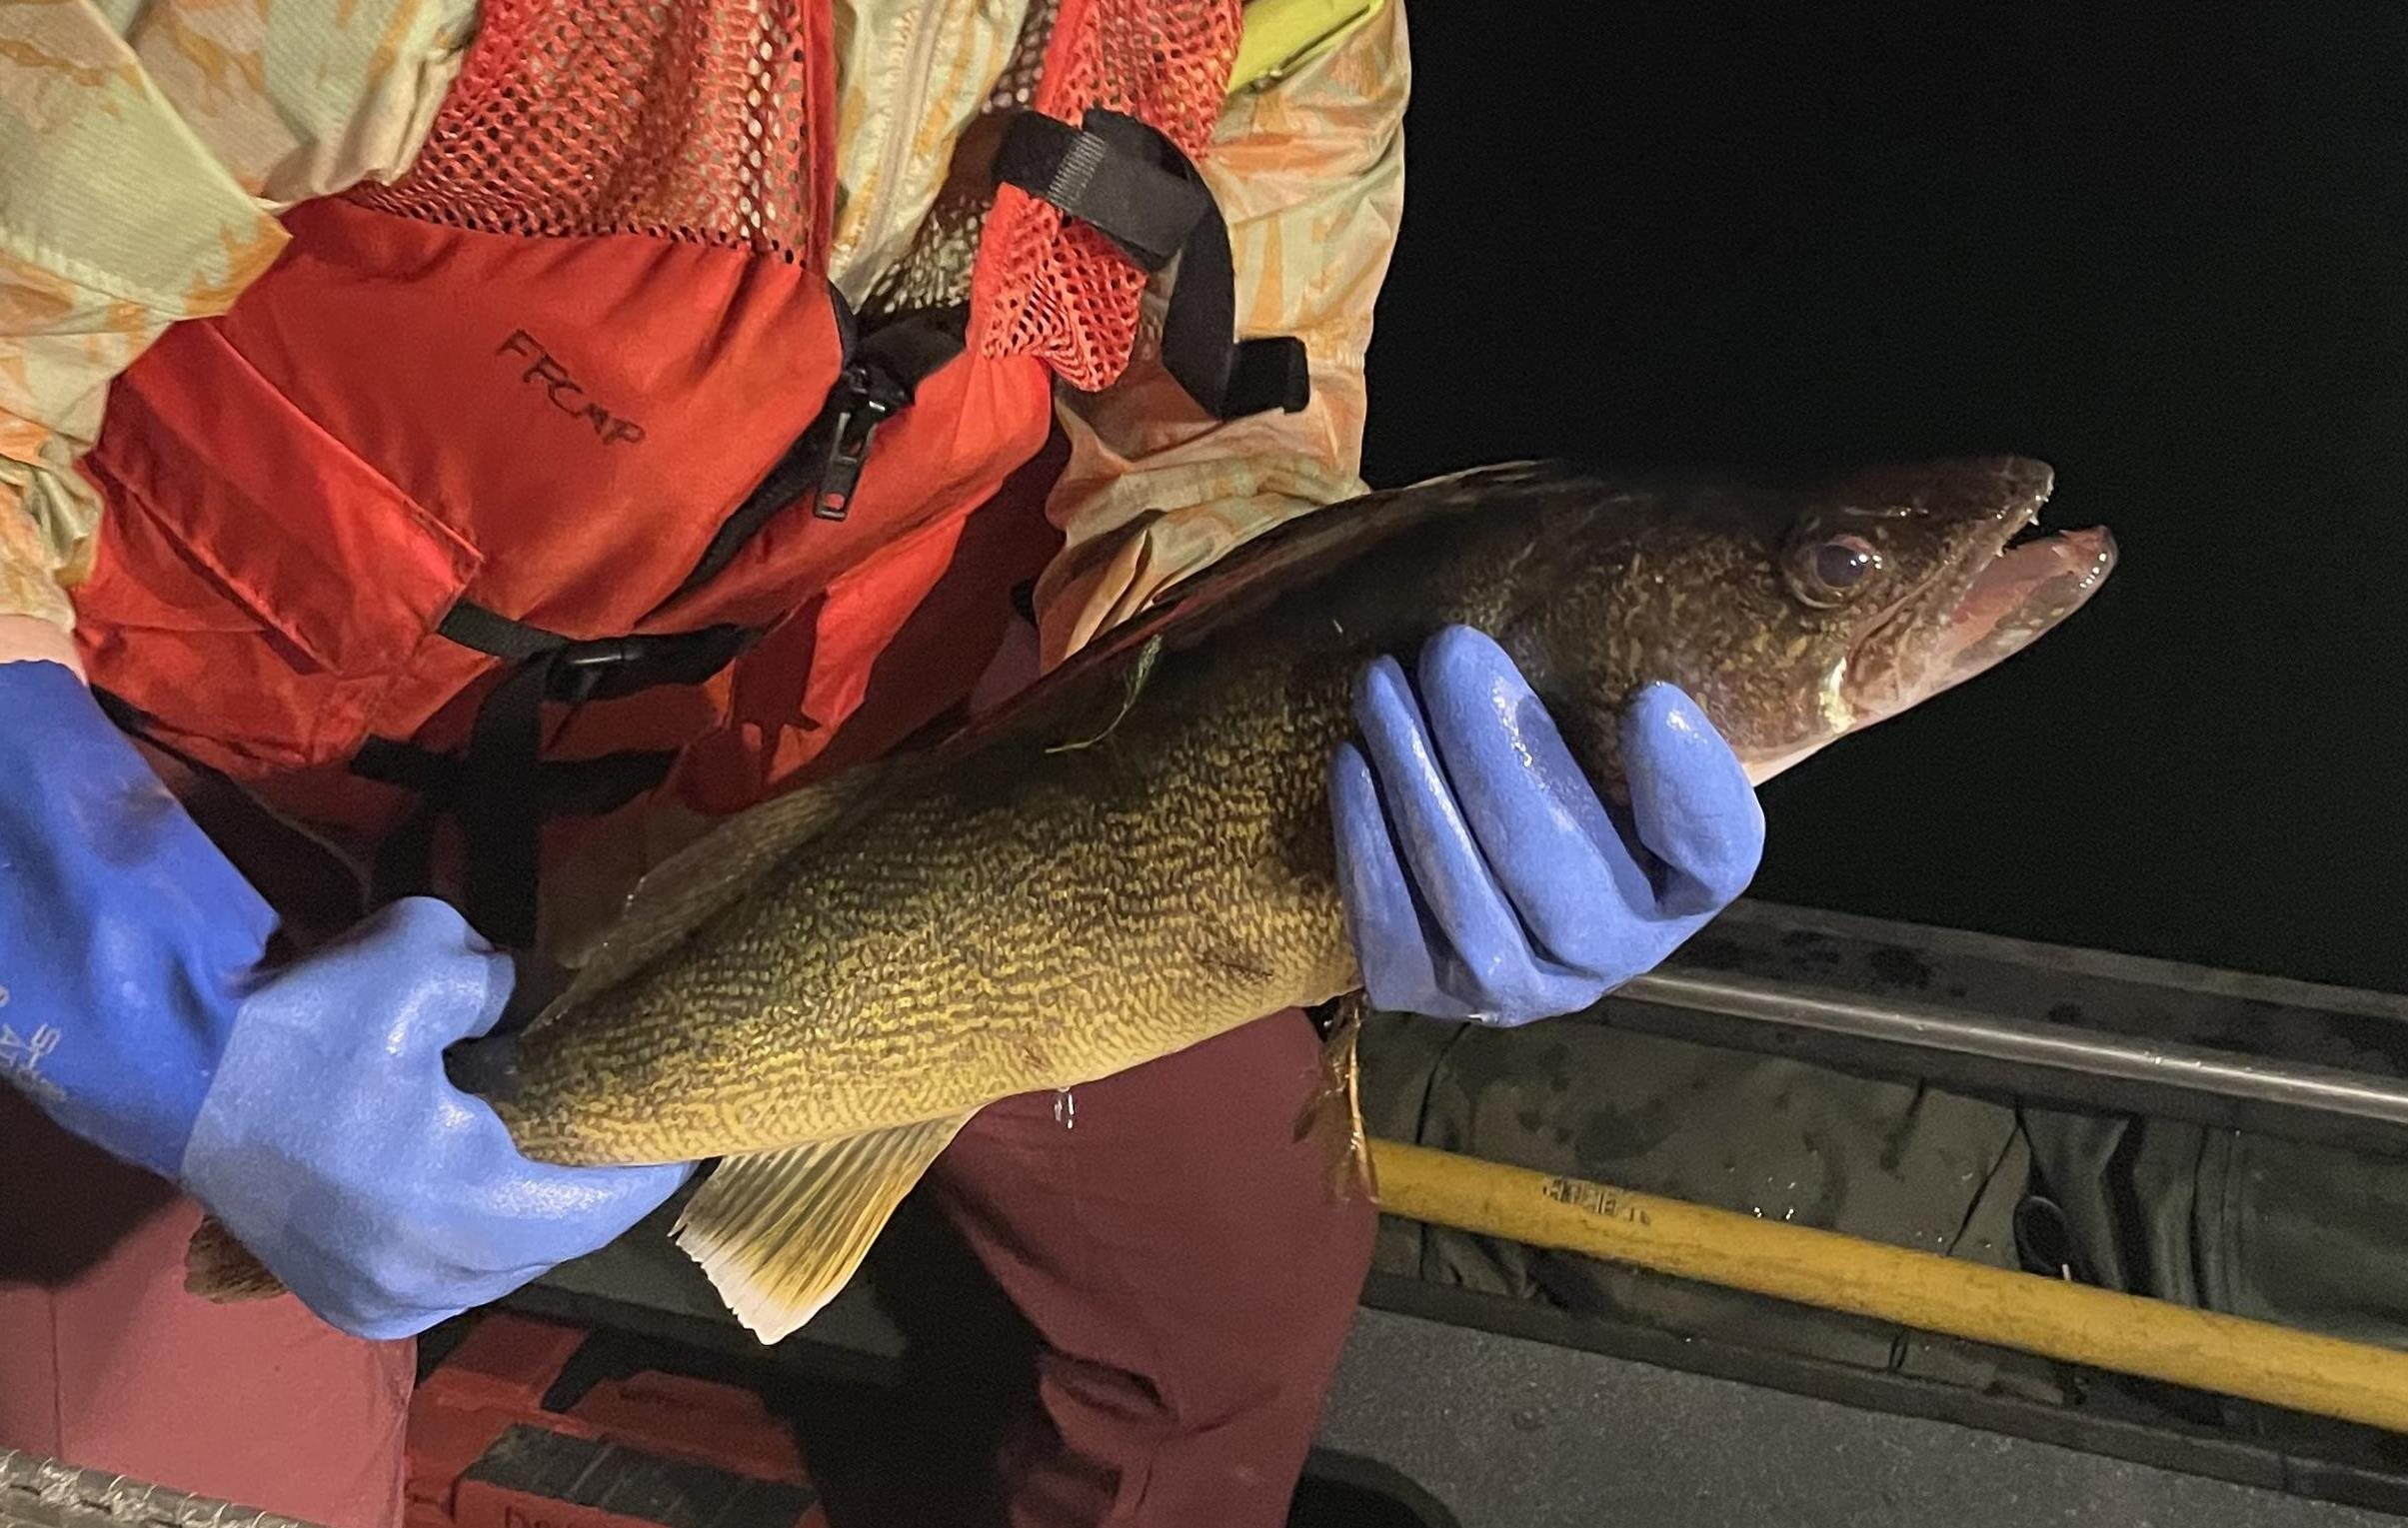
Walleye (S. vitreus)
Related links
Contact information
Callie Mathieu
PBT Monitoring Program Lead
callie.mathieu@ecy.wa.gov
360-407-6965