

Whether you’re curious about life in and under Puget Sound, need to learn more about mud, or just really want to look at cool pictures, our new story maps deserve a look.
Our Marine Sediment Monitoring Team recently released their first collection of interactive ArcGIS story maps. These provide an up-to-date description of their work assessing conditions and change over time in Puget Sound sediments and the critters who live in them.
We created these story maps to provide a visually captivating, interactive, and easy-to-read overview of our monitoring program while providing multi-level data summaries for sediment quality and invertebrate conditions in various urban bays and Puget Sound-wide. This new collection includes four introductory story maps and a fifth that summarizes our findings in Bellingham Bay. We plan to publish story maps for other locations in the future.
The first five story maps in our collection include:
Using this collection/resources
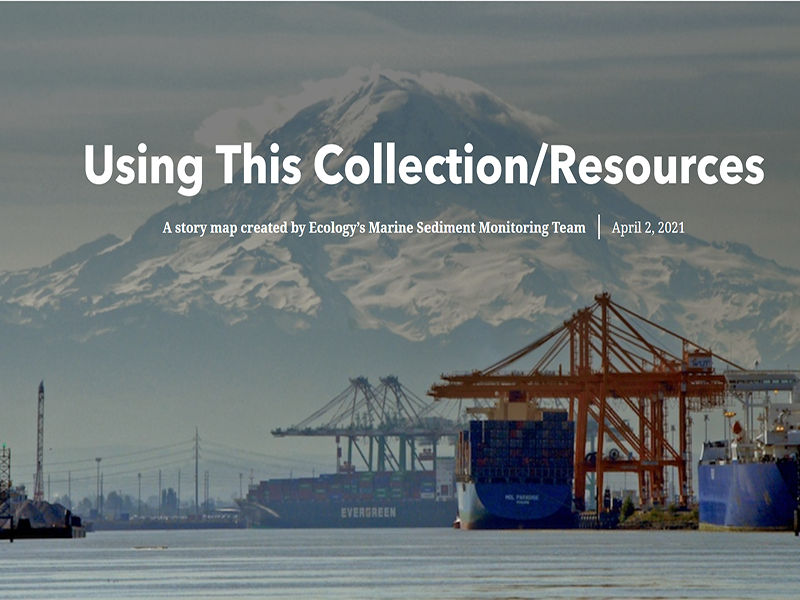
This story map provides information on how to read and interact with the team’s new Sediment Quality in Puget Sound story map collection. It contains instructions and a video tutorial on how to navigate interactive story map functions, a glossary of scientific terms, team contact information, references cited, and web links to more information about our work and where to get our data.
A conceptual model for Puget Sound sediments
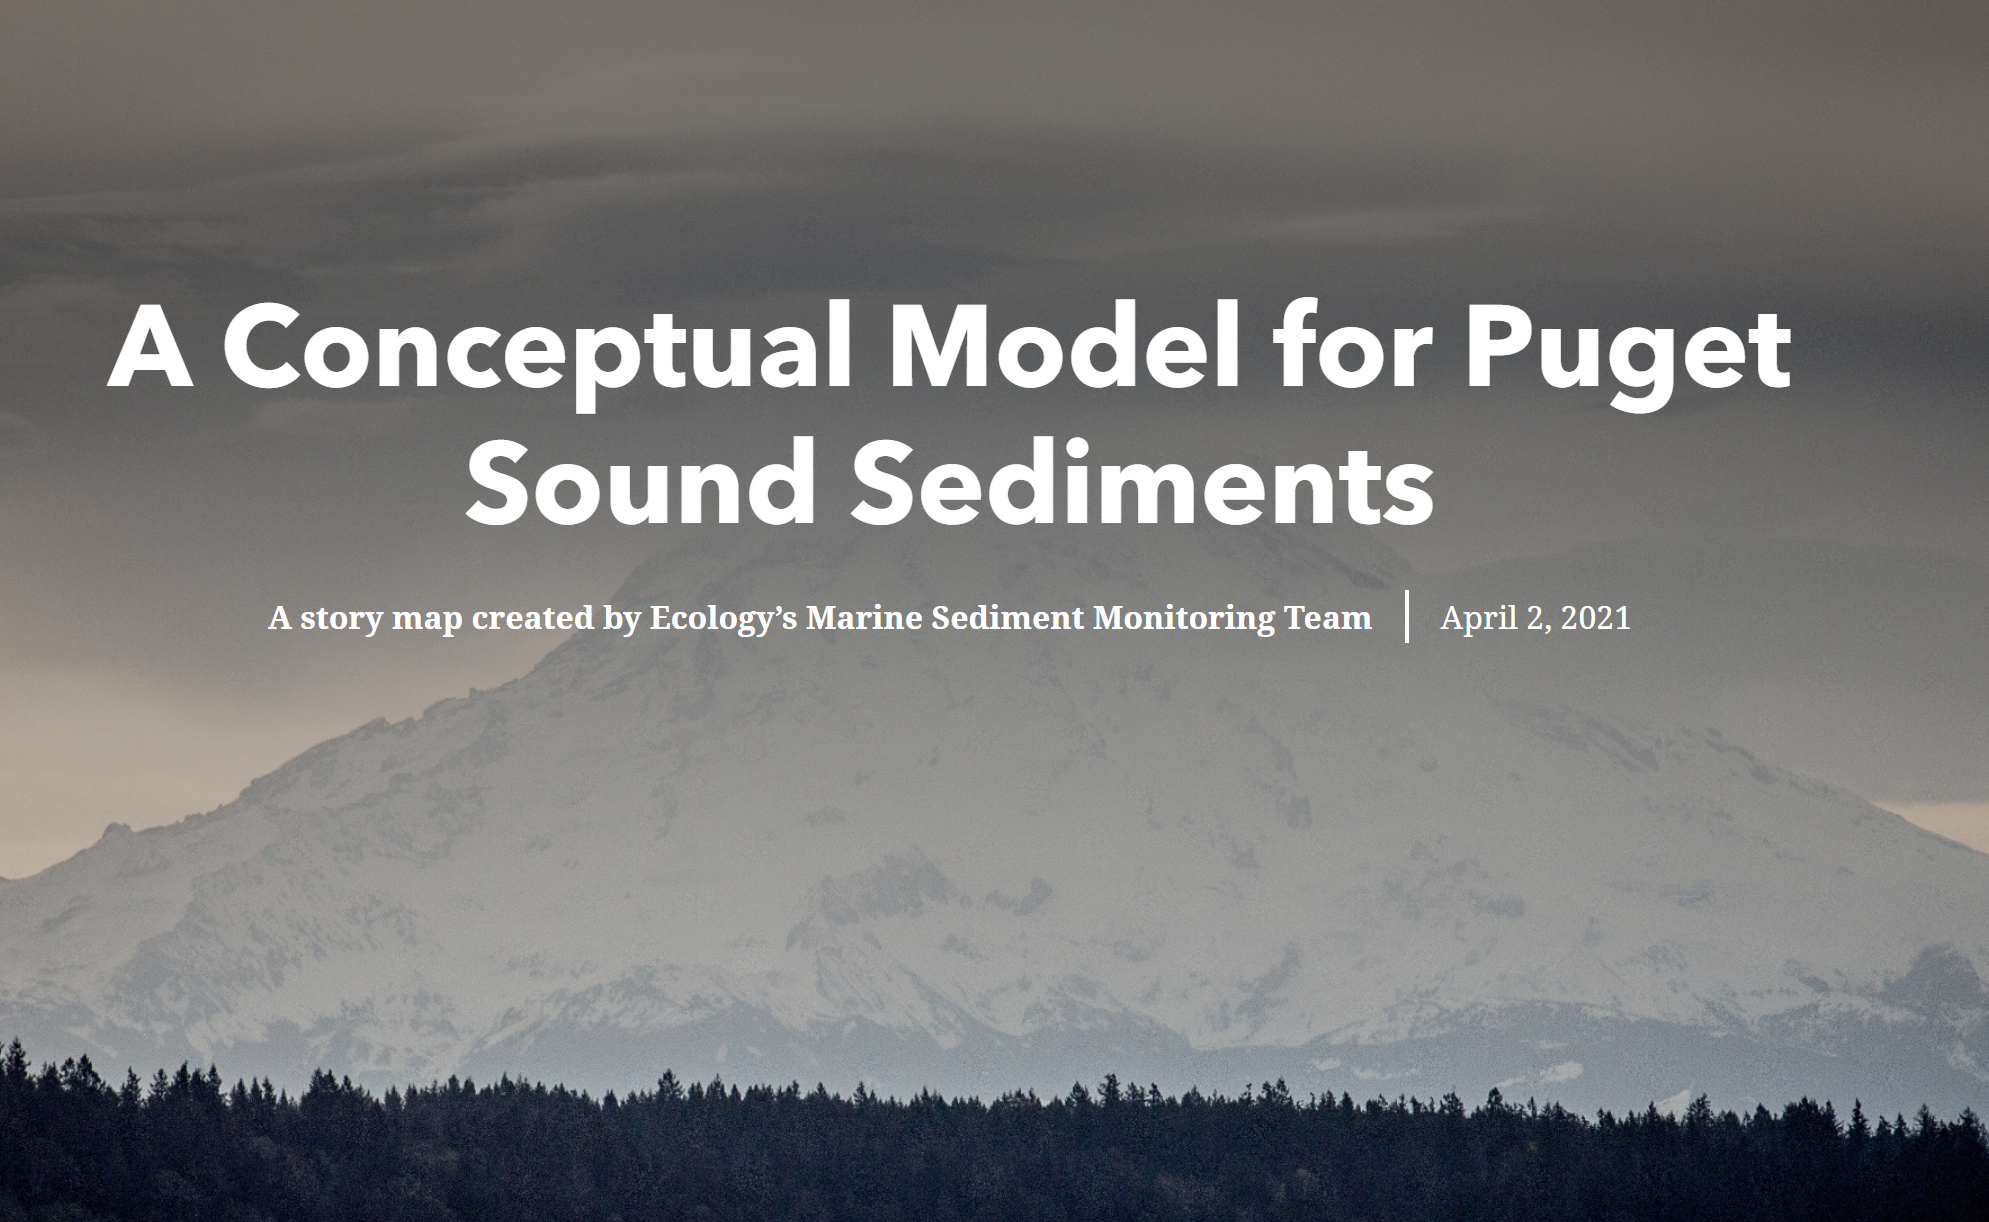
This story map provides a visualization of the Driver-Pressure-State-Impact-Response (DPSIR) conceptual model adopted for our Puget Sound Sediment Monitoring Program. This DPSIR model depicts scenarios where natural and human forces result in changes in climate and weather conditions, carbon and nutrient input, and toxic loading to the Puget Sound ecosystem, which ultimately influence the state of sediments, porewater, and bottom-dwelling invertebrates.
“The scoop” on what we do
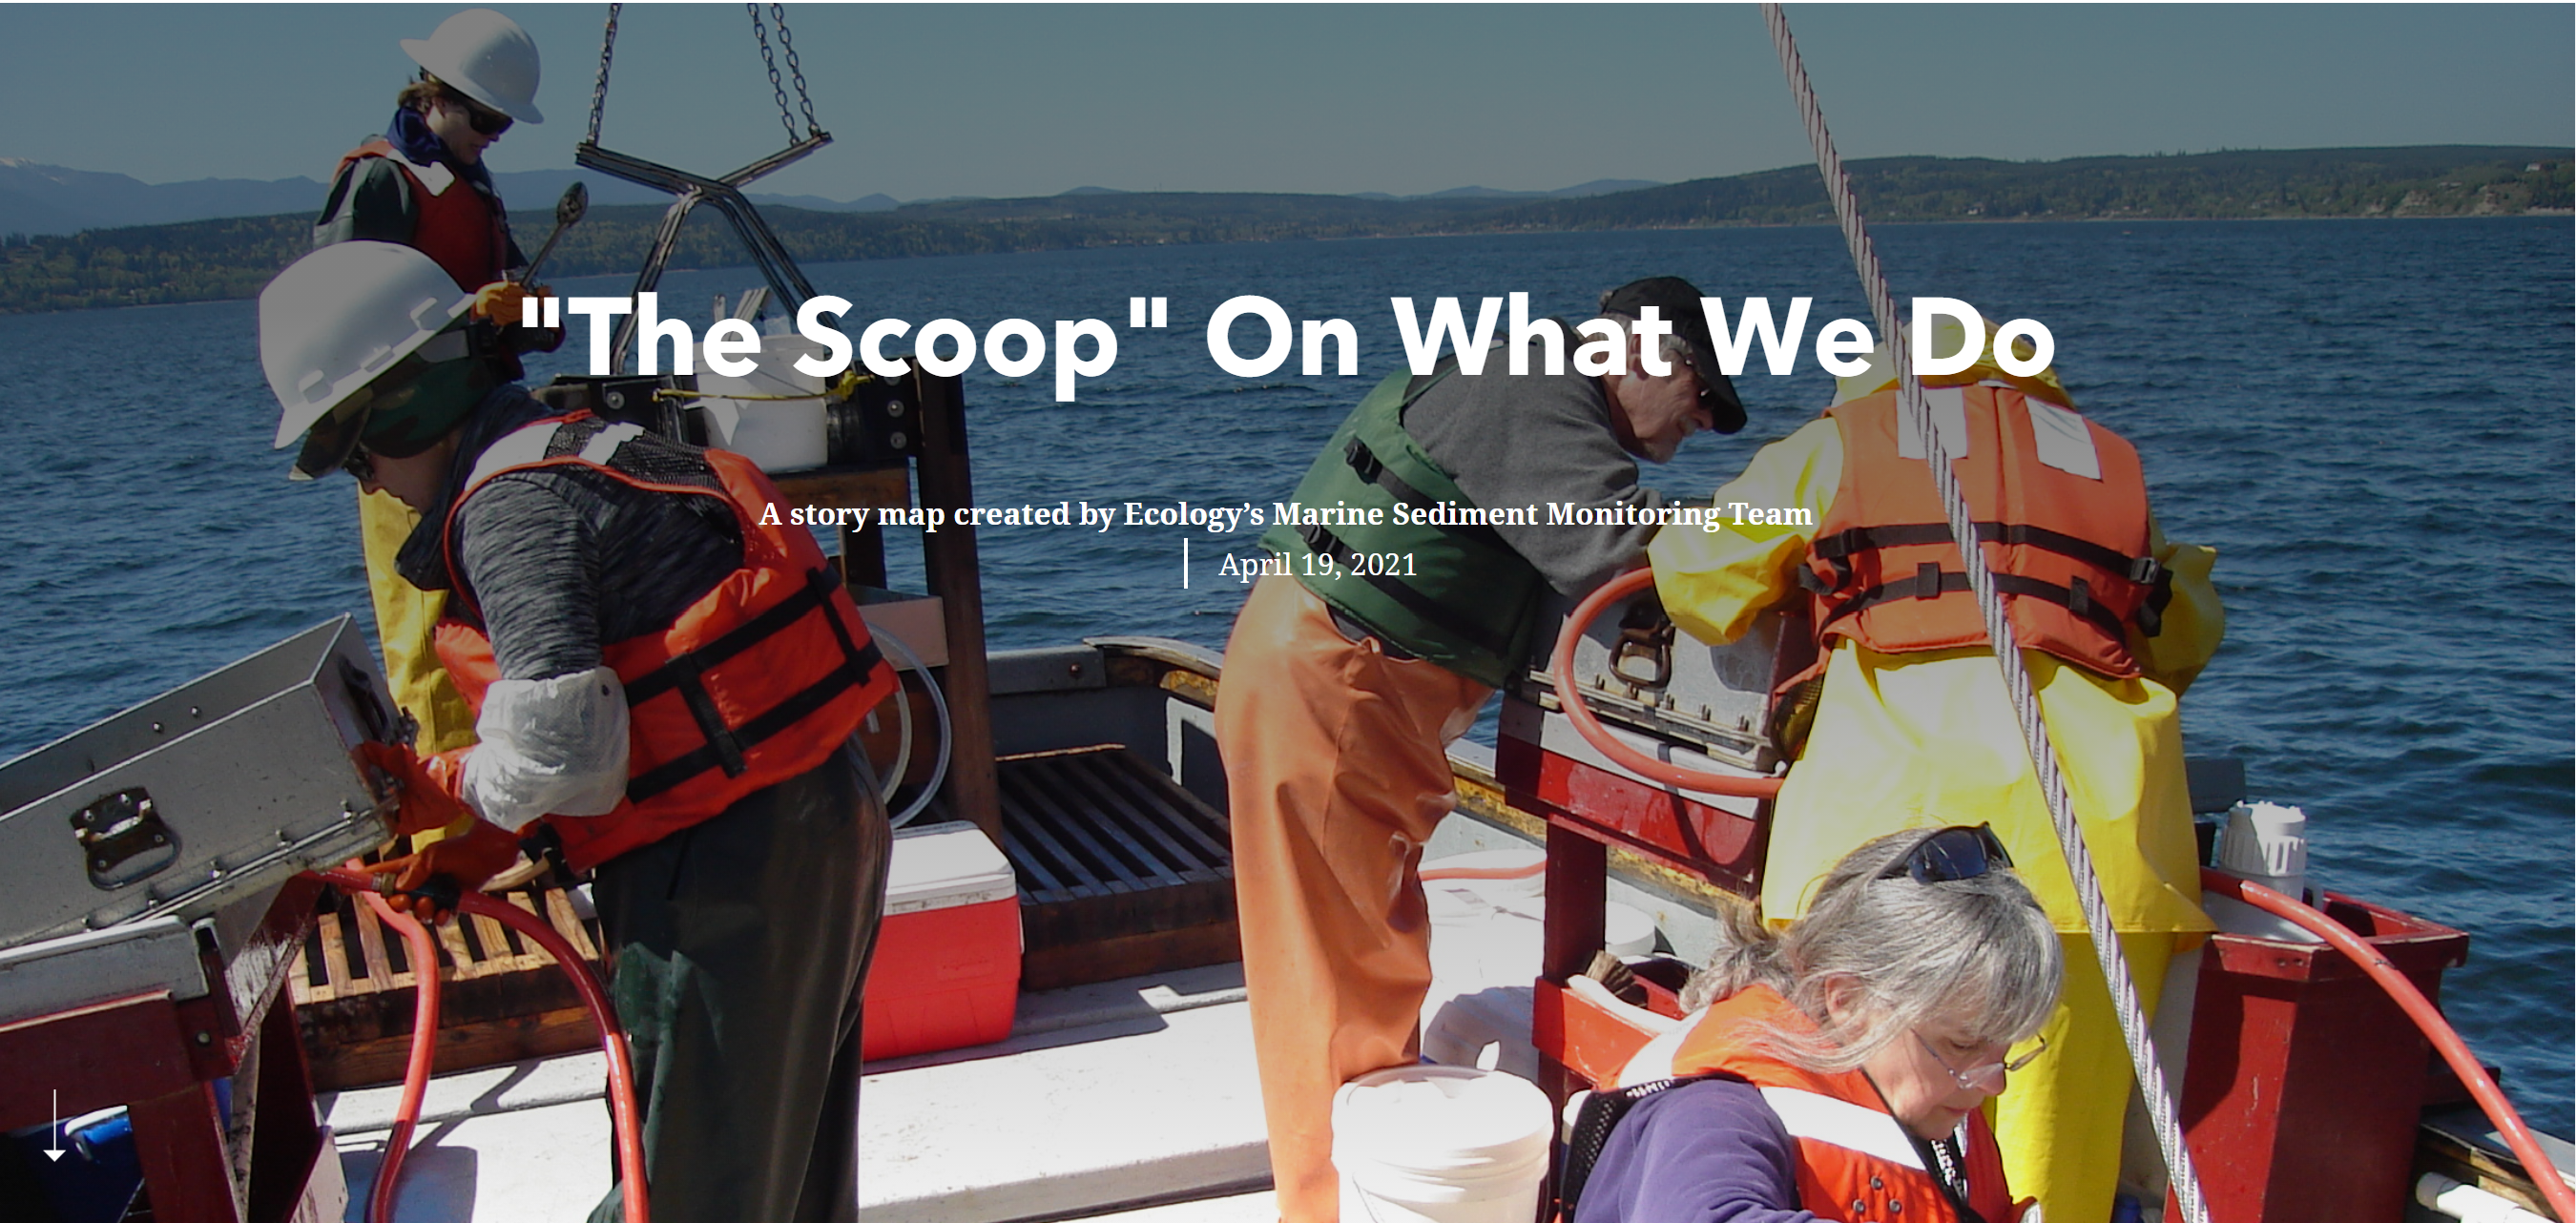
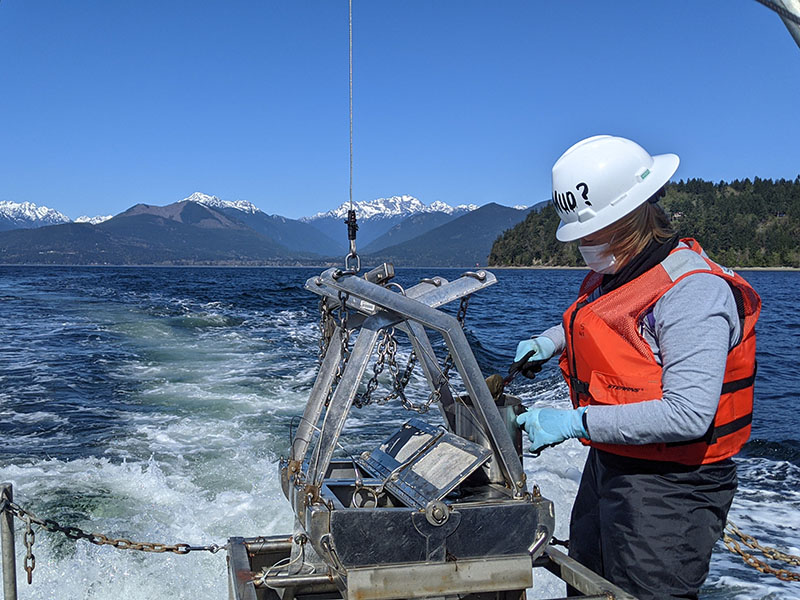
This story map shows how we collect sediment for the Puget Sound Sediment Monitoring Program. It also details how and why we examine the physical, biogeochemical, and chemical contaminant properties of sediments to understand their influence on the community structure of the invertebrates living in them.
Urban Bays program
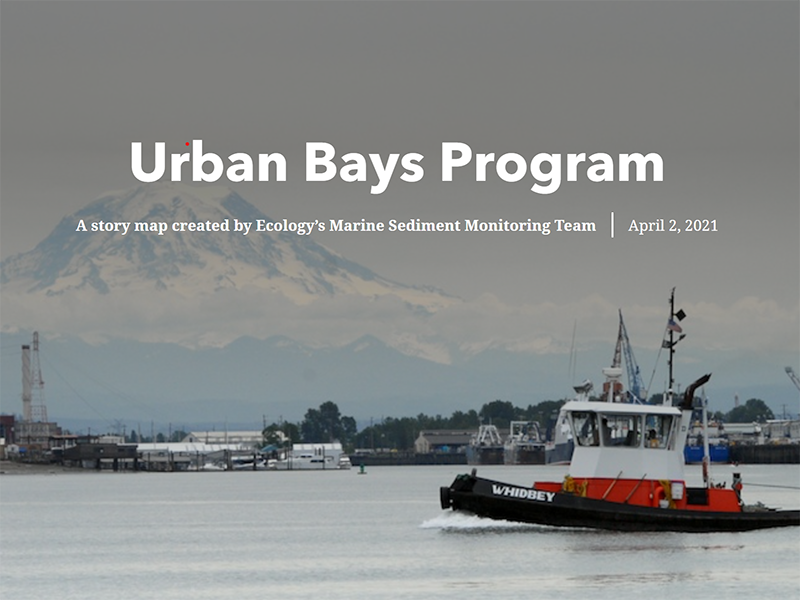
This story map provides an overview of the Urban Bays component of the Puget Sound Sediment Monitoring Program, including a summary of characteristics of the six urban bays we study: Bellingham Bay, Port Gardner/Everett Harbor, Elliott Bay, Bainbridge Basin, Commencement Bay, and Budd Inlet.
Bellingham Bay: Sediment quality results – 2017
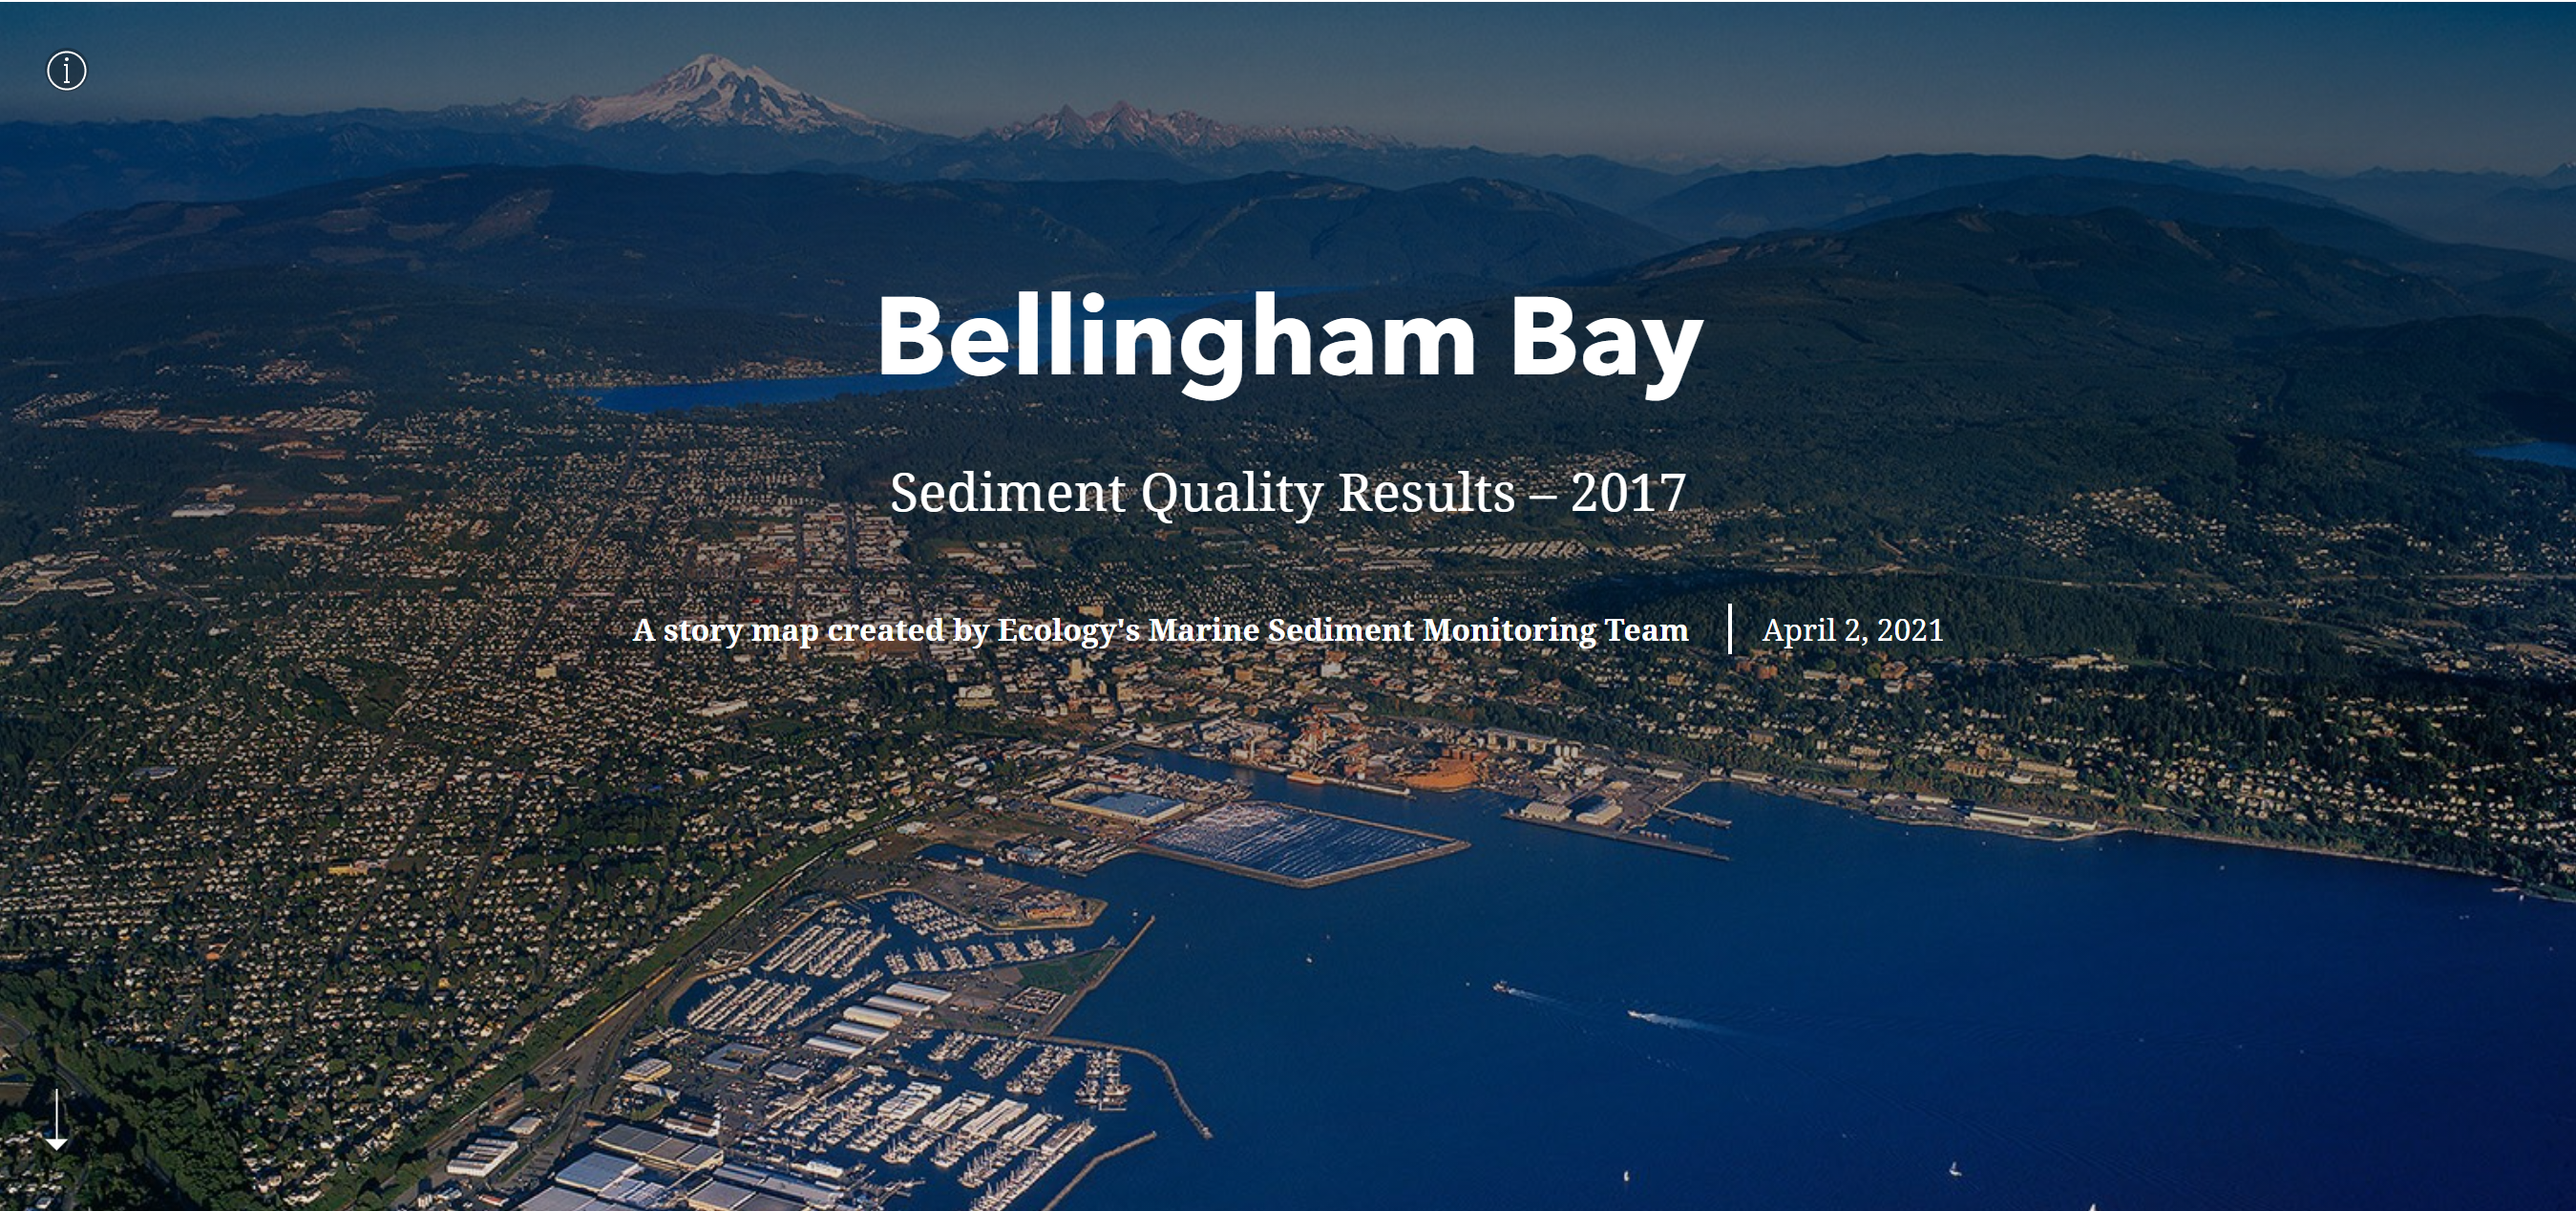
This story map provides a summary of findings from analysis of physical, biogeochemical, and chemical contaminant parameters measured in sediment samples, and the composition of the sediment-dwelling invertebrate communities sampled from 30 monitoring stations in Bellingham Bay in June 2017. These results are also compared to those from our previous survey conducted in 2010.
For questions about these story maps and our monitoring work, please contact any of the Marine Sediment Monitoring Team members:
Margaret Dutch margaret.dutch@ecy.wa.gov
Sandra Weakland sandra.weakland@ecy.wa.gov
Valerie Partridge valerie.partridge@ecy.wa.gov
Dany Burgess dany.burgess@ecy.wa.gov