Watershed Health - Statewide Report
We investigated the health of streams in Washington state and have two rounds of statewide data complete. There has shown to be a slight majority of stream kilometers in good biological condition, while indicators related to stream substrate consistently show high percentages of poor conditions.

Use the map to navigate our reports by Status and Trends Region.
Statewide summary
- Benthic Index of Biotic Integrity (B-IBI) conditions were fairly consistent statewide, with just under half of the stream kilometers assessed classified as being in good condition.
- The most prevalent indicators found statewide were relative bed stability, elevated nitrogen, elevated sand and fine sediments, and low dissolved oxygen.
*These results are from Round 1 (completed in 2012) and Round 2 (completed in 2019) only. Round 3 is currently in progress and not included in this report.
Biological condition
We found the invertebrate biological condition of streams throughout Washington to be consistent when comparing sampling round 1 and round 2. The majority of stream kilometers were classified as good, remaining between 40 and 50 percent in both sampling rounds. Streams classified as poor remained around 30 to 35 percent, and streams classified as fair remained around 20 to 25 percent.
This shows, on a statewide scale, that almost half of streams are in good condition, but that there are still a considerable amount of streams in poor biological condition. When considering salmon habitat and water quality throughout the state, it may be important to note that over 30 percent of stream kilometers are in poor condition.
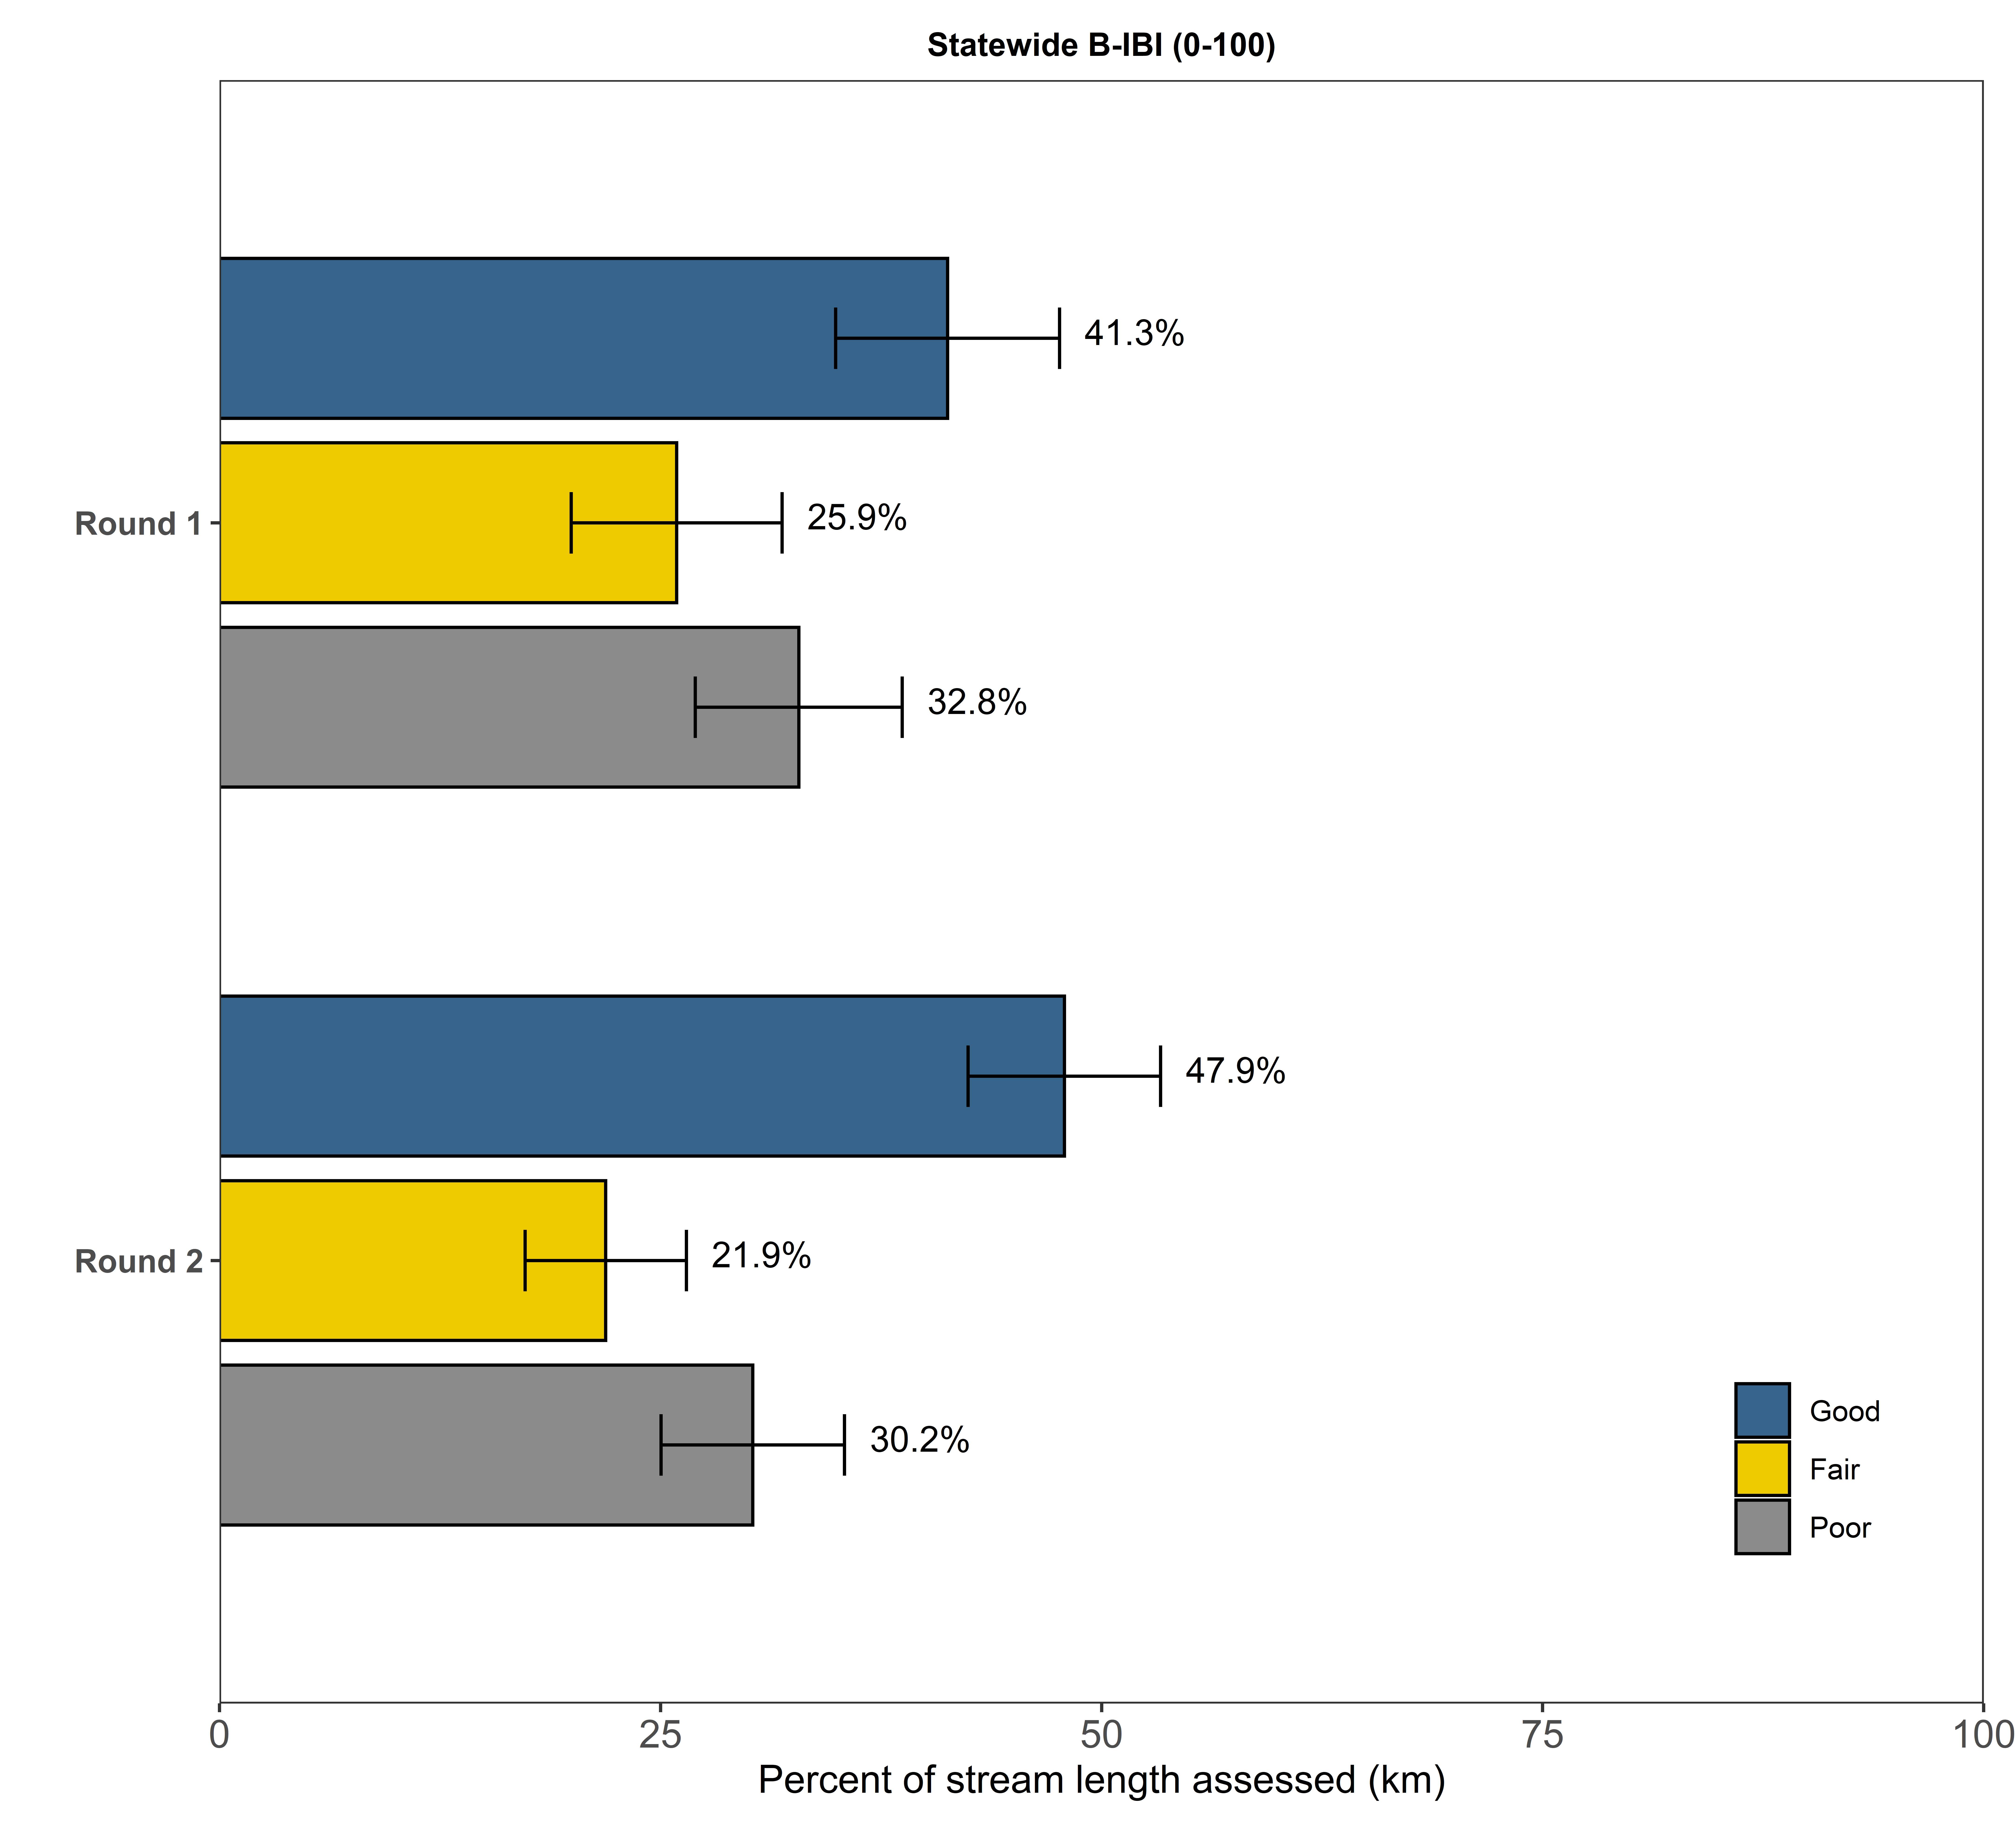
We used B-IBI scores in Rounds 1 (2009-2012) and 2 (2013-2019) to obtain good, fair, and poor ratings statewide. Error bars represent 95% confidence intervals.
Physical and chemical indicators
Across the state, the most prevalent indicator was low bed stability, with poor conditions at nearly 70 percent of the stream kilometers assessed. We also saw a high percentage of sands or fines, elevated nitrogen, and low dissolved oxygen levels.
The first two sampling rounds show relatively consistent results, though a third round of data will be needed to see any trends.
To interact with this graph and learn more about these physiochemical indicators, hold your mouse over each bar.
This interactive graph shows the percentage of stream kilometers assessed with poor physiochemical conditions for Washington state. The x-axis represents the percentage of river extent in poor condition. Error bars show 95 percent confidence intervals.


