

Watershed health — Lower Columbia update
We investigated the health of stream habitats in the Lower Columbia Status and Trends Region in 2010, 2014, and 2023. Data from these three sampling rounds show a majority of good biological conditions, but there is widespread poor relative bed stability.
Use the map to navigate our reports by Status and Trends Region.
Regional summary
- Benthic Index of Biotic Integrity scores in the Lower Columbia Region show a similar number of streams in good biological condition, but the proportion of streams in fair and poor conditions varied.
- The most prevalent indicators for streams in the Lower Columbia Region were poor relative bed stability, elevated nitrogen concentrations, and elevated sand/fines percentages.
Biological condition
In 2010, 2014, and 2023 invertebrate biological conditions classified as good remained similar, all years showed around 50 percent of streams kilometers in good condition. The proportion of streams classified as fair and poor varied between the three sampling years, but a large increase in fair conditions were seen in 2023.
We used B-IBI ratings from 2010, 2014, and 2023 to obtain the percentage of stream kilometers in good, fair, and poor conditions for the Lower Columbia Region. Error bars represent 95% confidence.
Physical and chemical indicators
The Lower Columbia Region has been sampled three times, giving us much more insight on trends in this region. The indicators for this region were categorized into "Physcial Indicators" and "Chemical Indicators." Click the corresponding boxes on the graph below to view each category.
Physical indicators, like bed stability, percentage of sands or fines, residual pool depth, and average embeddedness, showed an increasing trend of poor conditions over time. Notably, the percentage of stream kilometers indicating poor bed stability was over 60 percent for 2010, 2014, and 2023.
Chemical indicators showed slightly more consistent trends. High nitrogen levels and low amounts of dissolved oxygen indicated poor conditions for over 40 percent of stream kilometers in all three sampling years.
To interact with this graph and learn more about these physiochemical conditions, hold your mouse over each bar.
This interactive graph shows the percentage of stream kilometers assessed with poor physiochemical conditions in the Lower Columbia Region for 2010 and 2014. The x-axis represents the percentage of river extent in poor condition. Error bars show 95 percent confidence intervals.
Flip through our field photos!
Large woody debris can provide shade and fish cover in streams and rivers.
A crewmember measures a wetted depth at Trapper Creek.
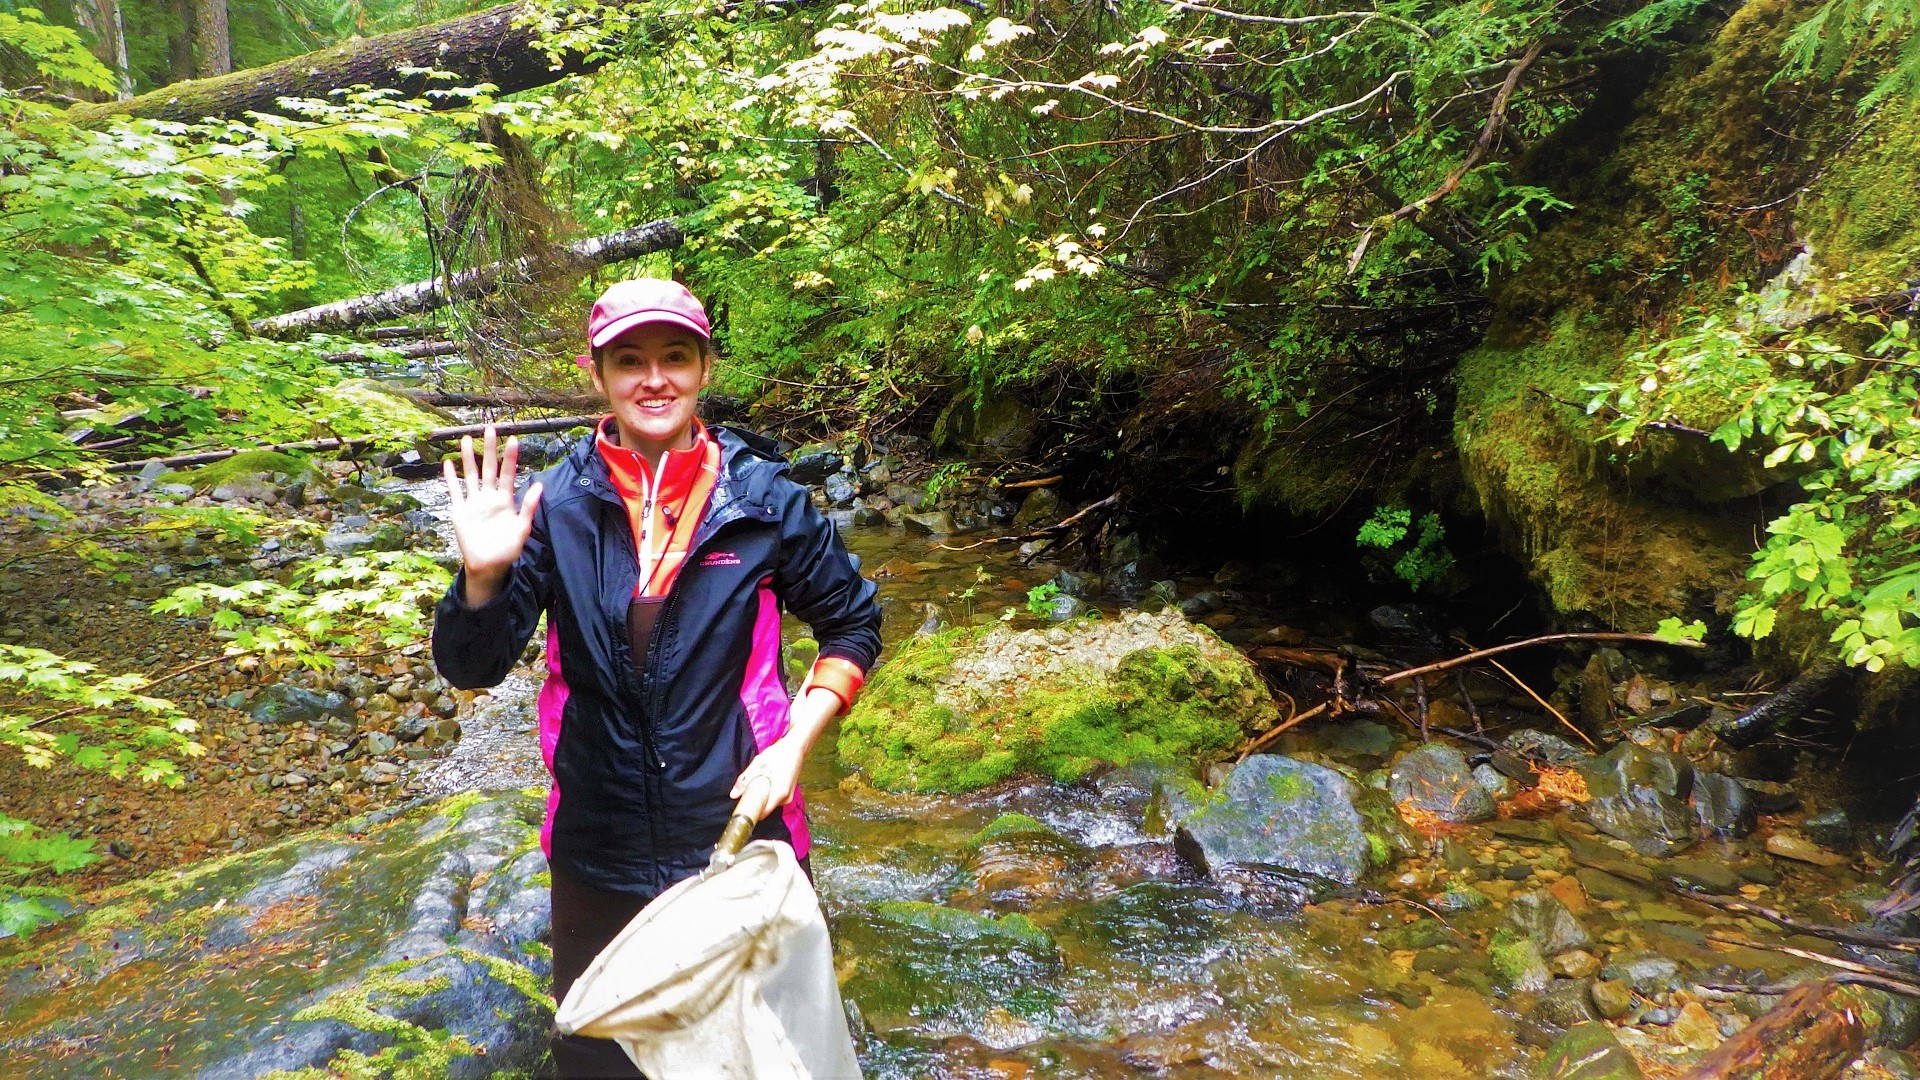
Crewmember waves while on their way to collect an invertebrate sample.
Cutthroat trout are easily identified by a red slash under the jawline.
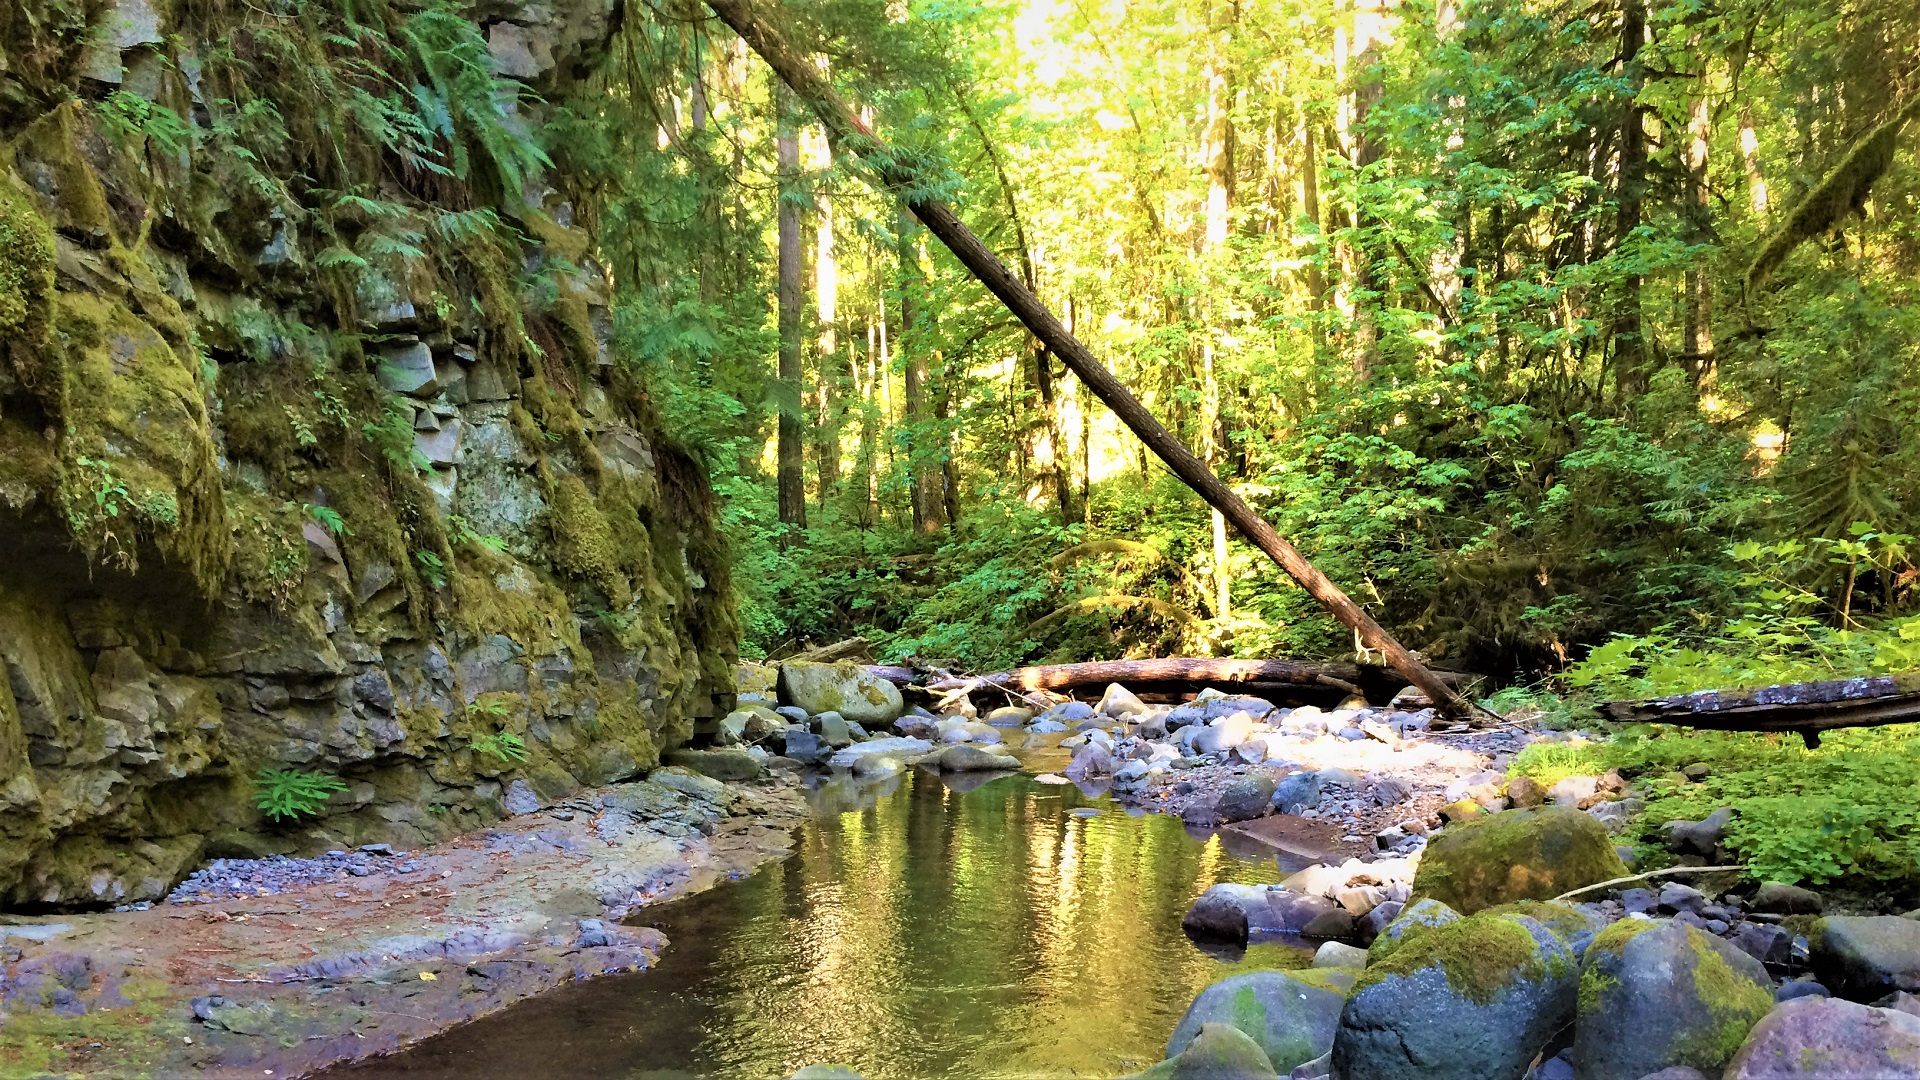
Bear Creek provides reference data because it has excellent B-IBI macroinvertebrate scores.
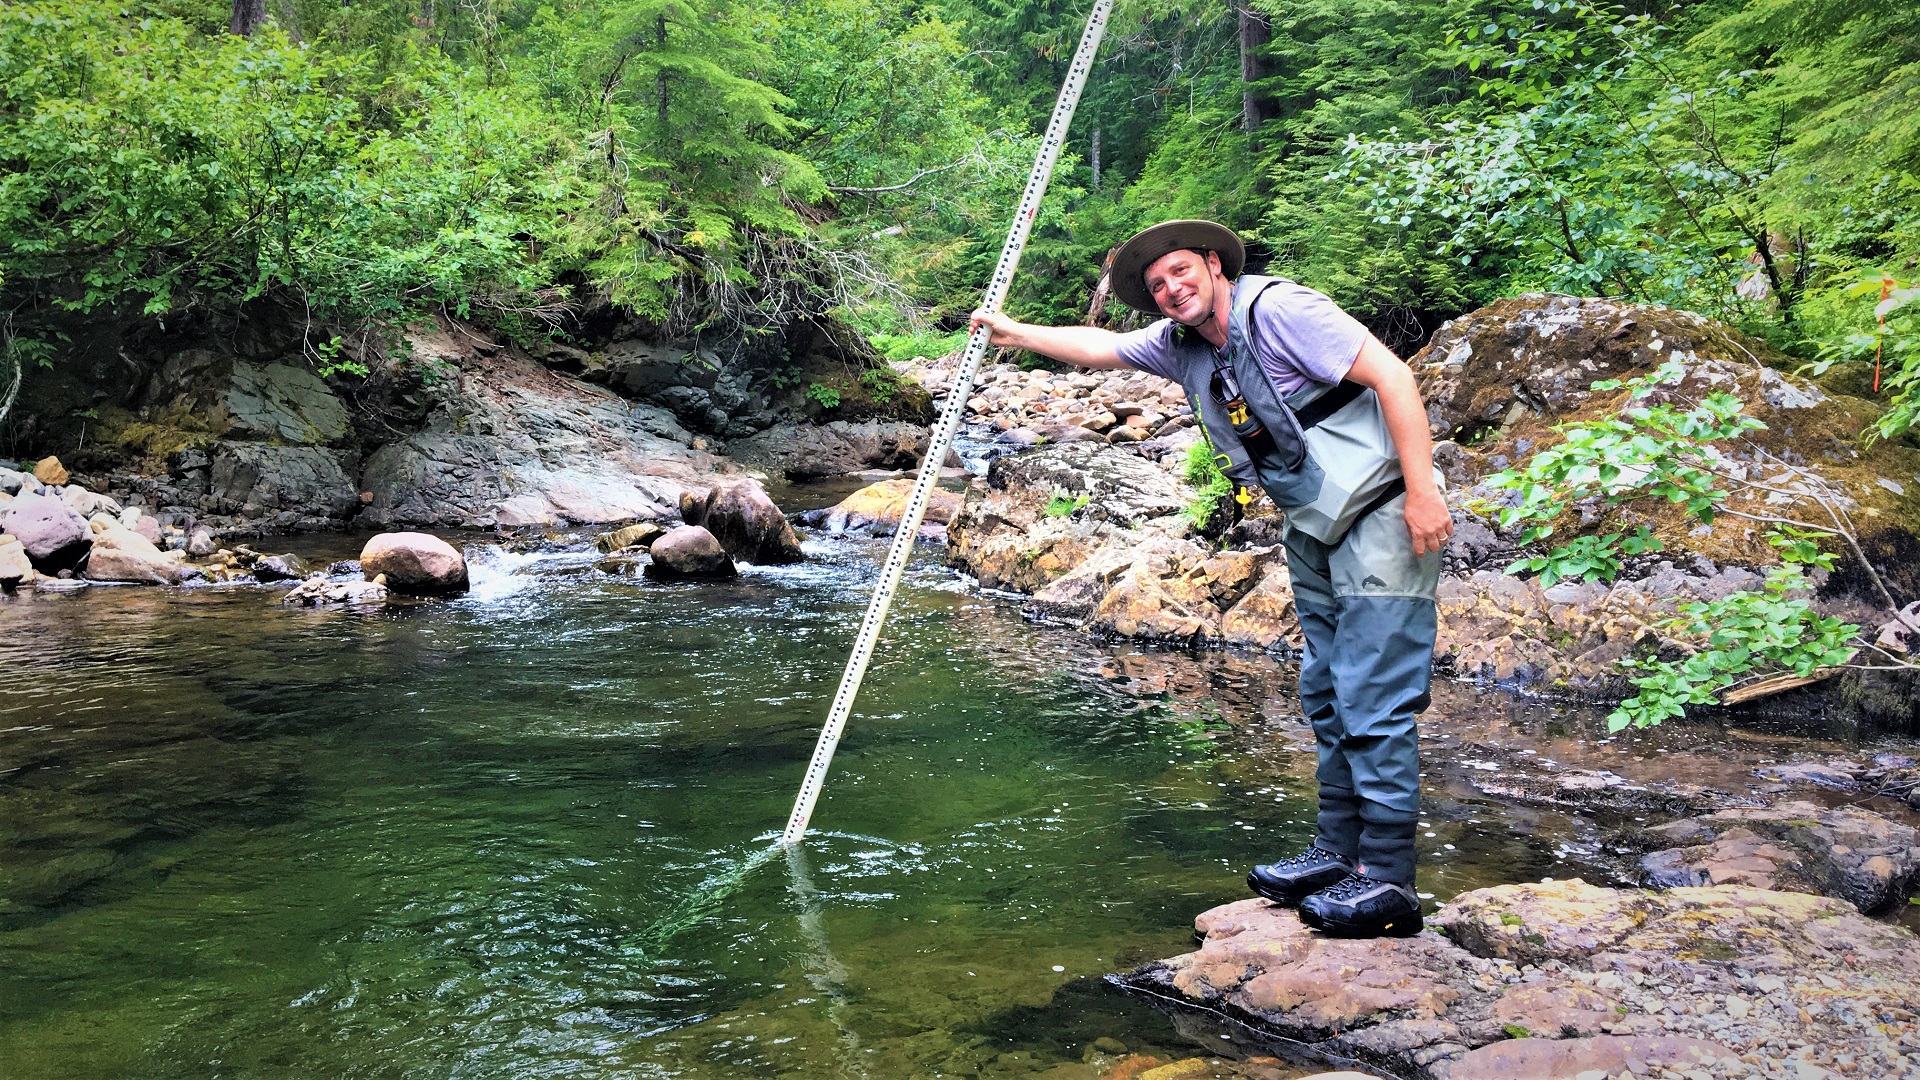
Measuring maximum pool depths can sometimes be tricky; luckily, there are rocks to stand on!
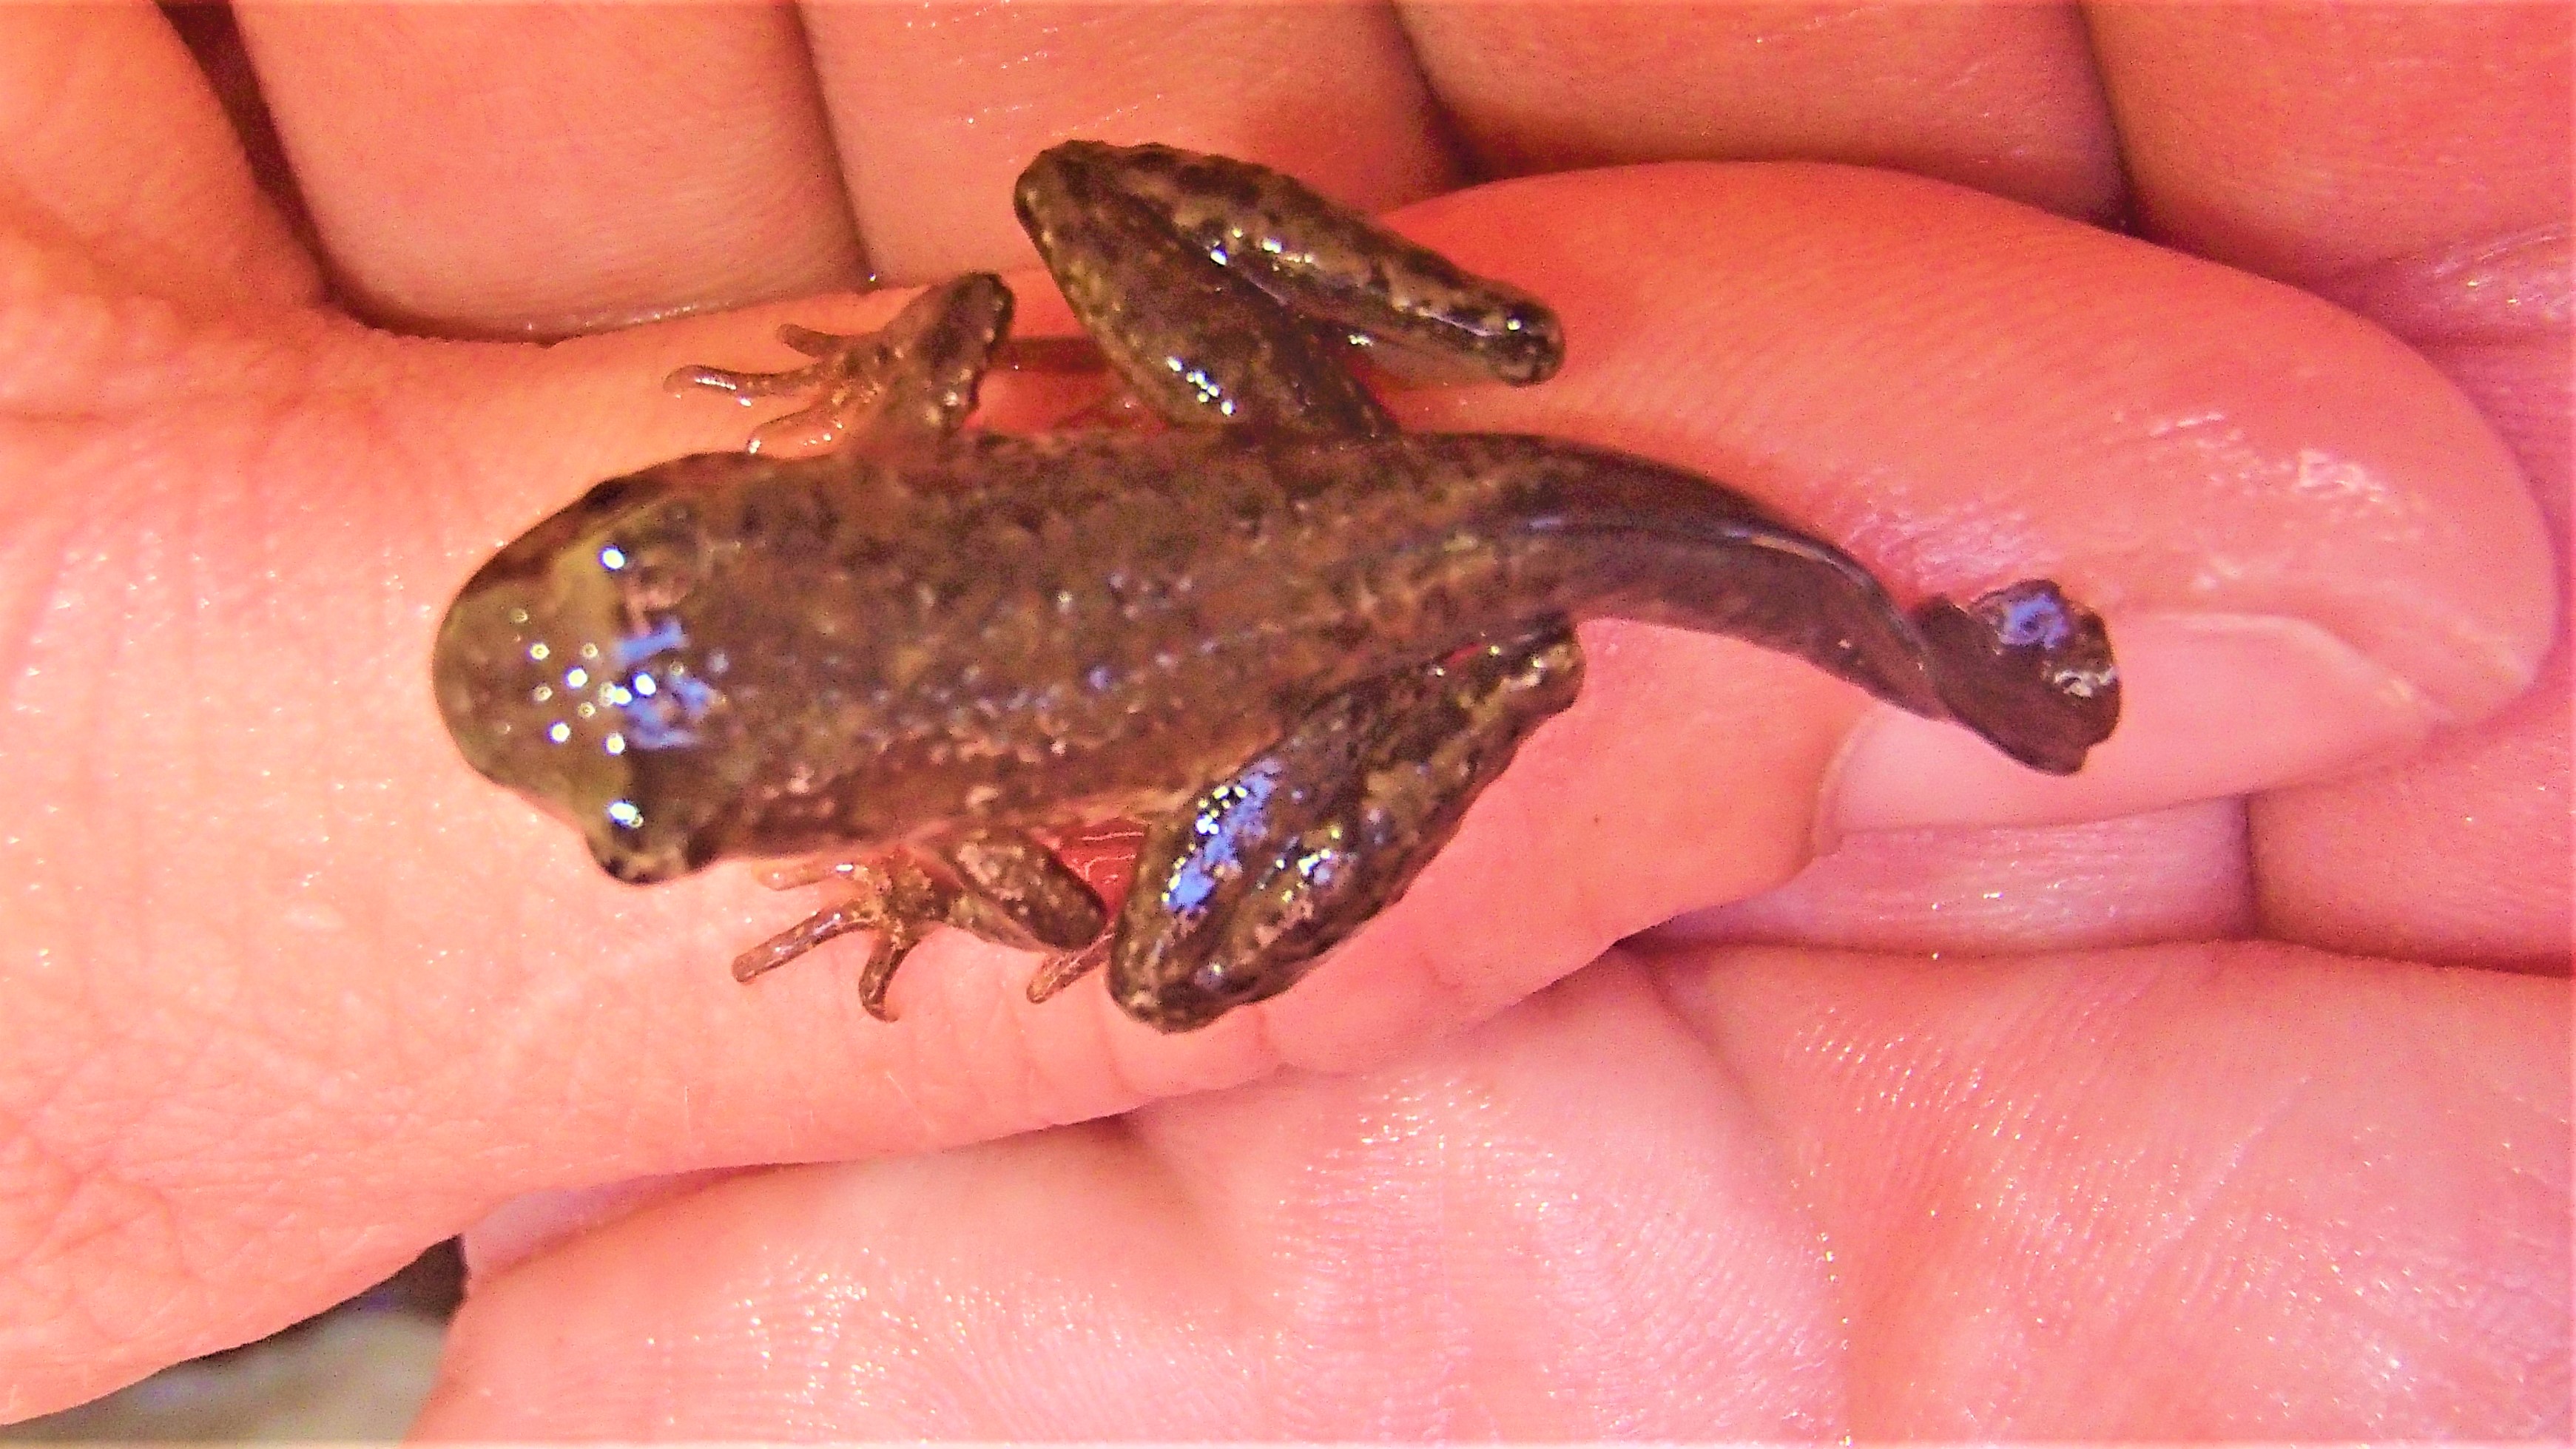
This tailed frog will continue to grow into an adult.
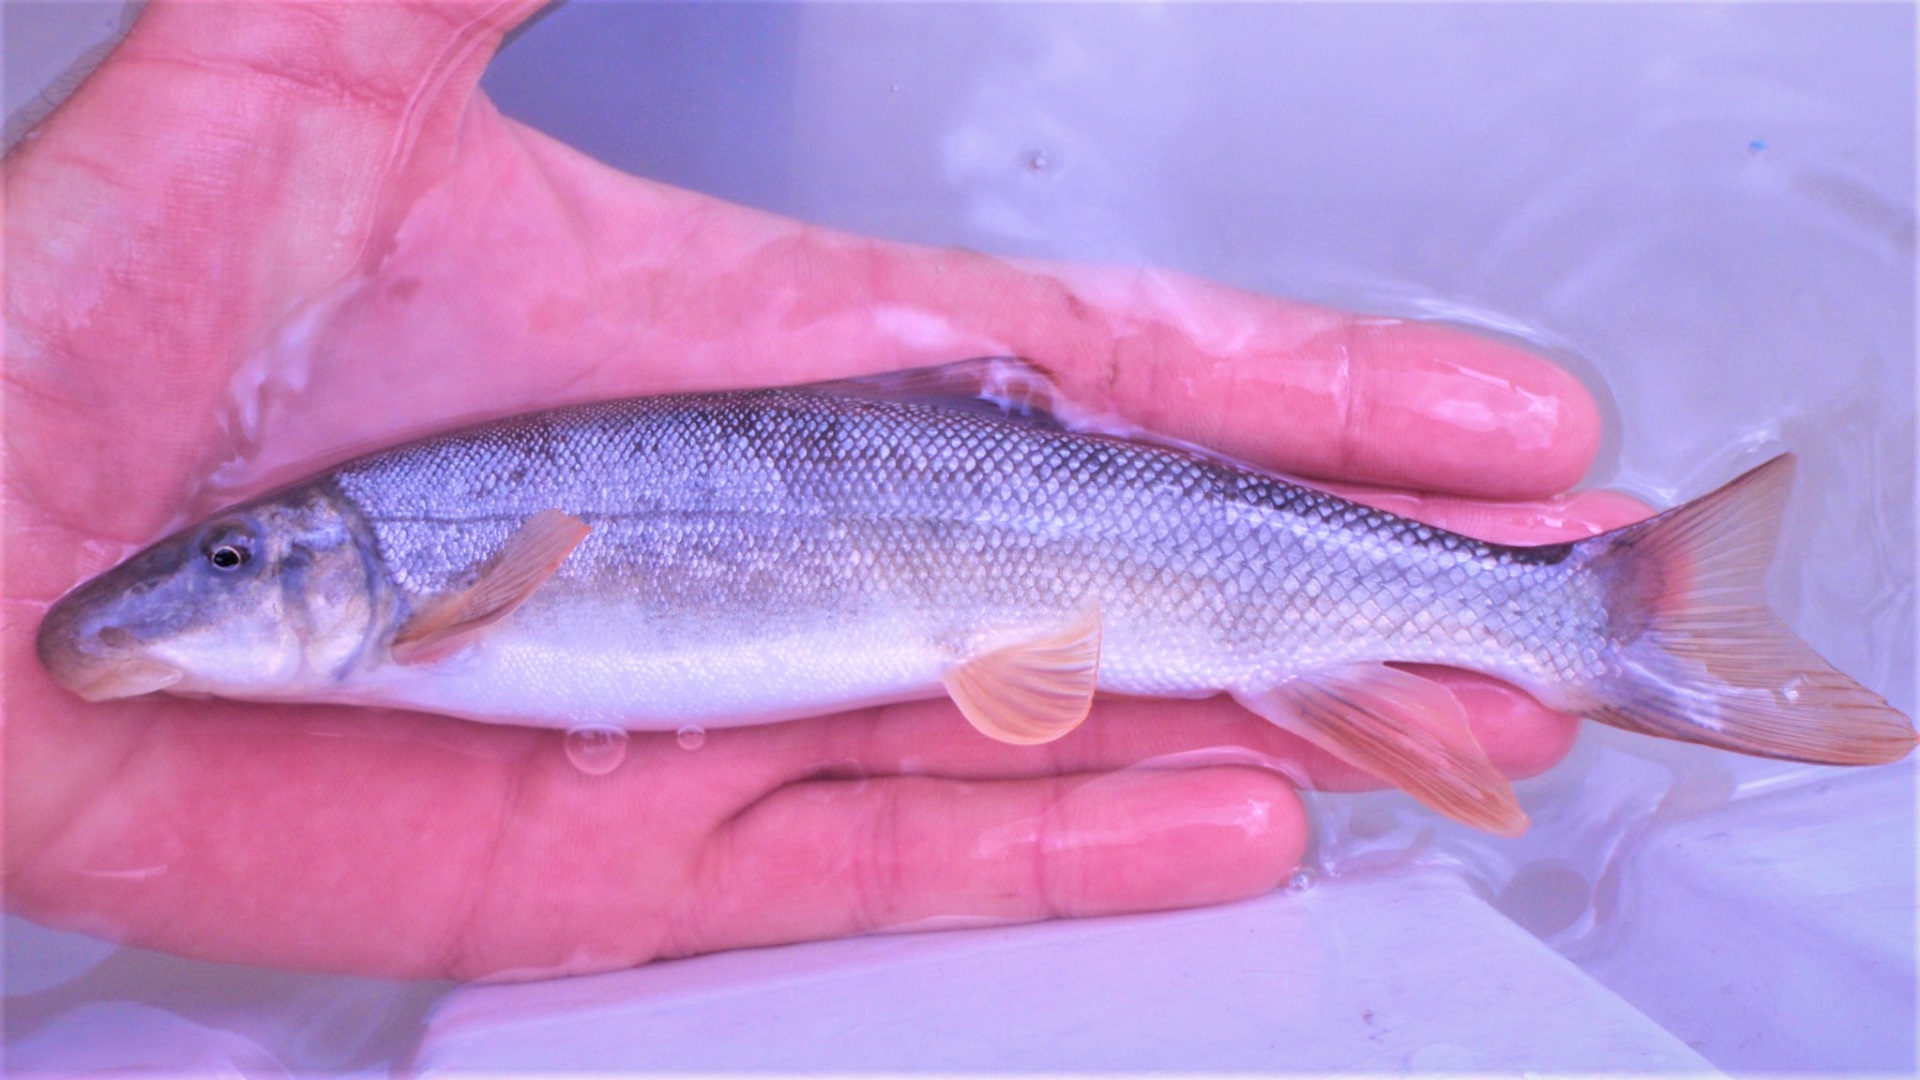
A mountain sucker fish from the Toutle River
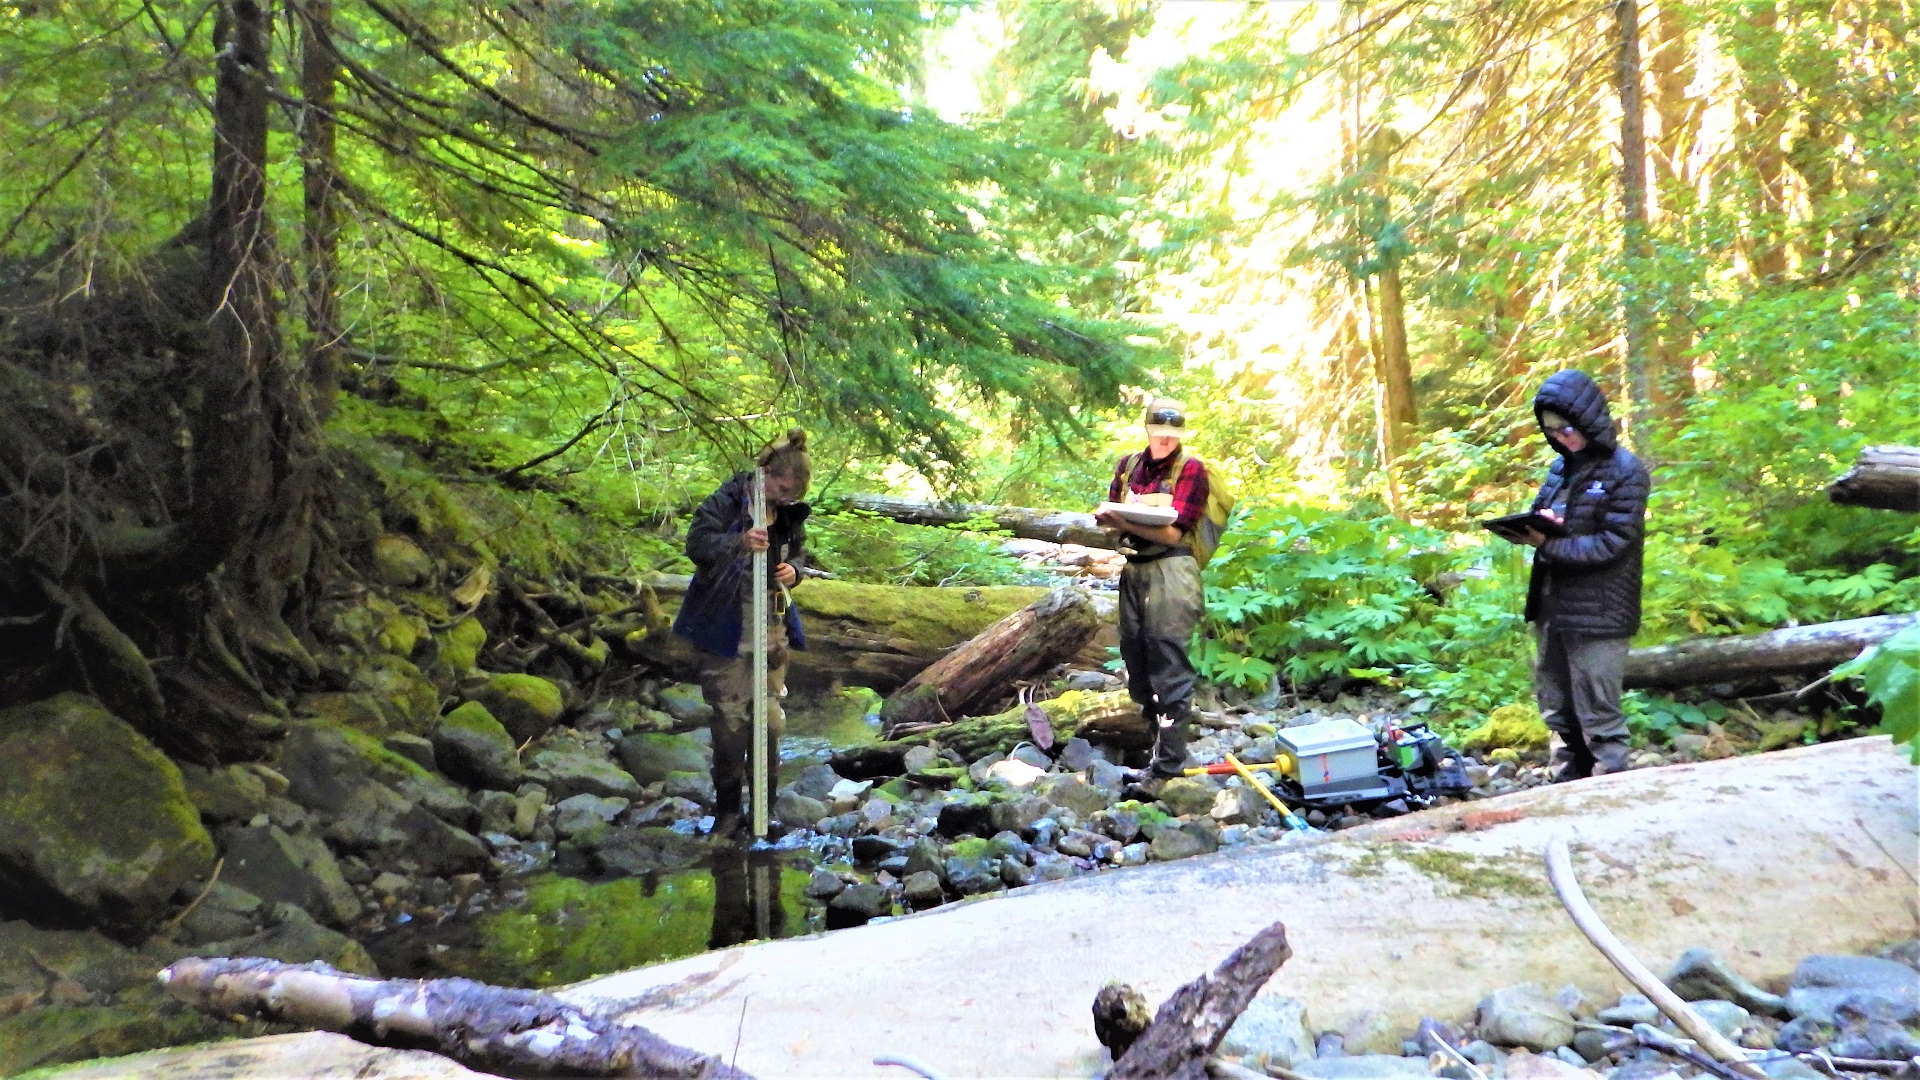
Crewmembers conduct a habitat survey at Laughingwater Creek near Mount Rainier.
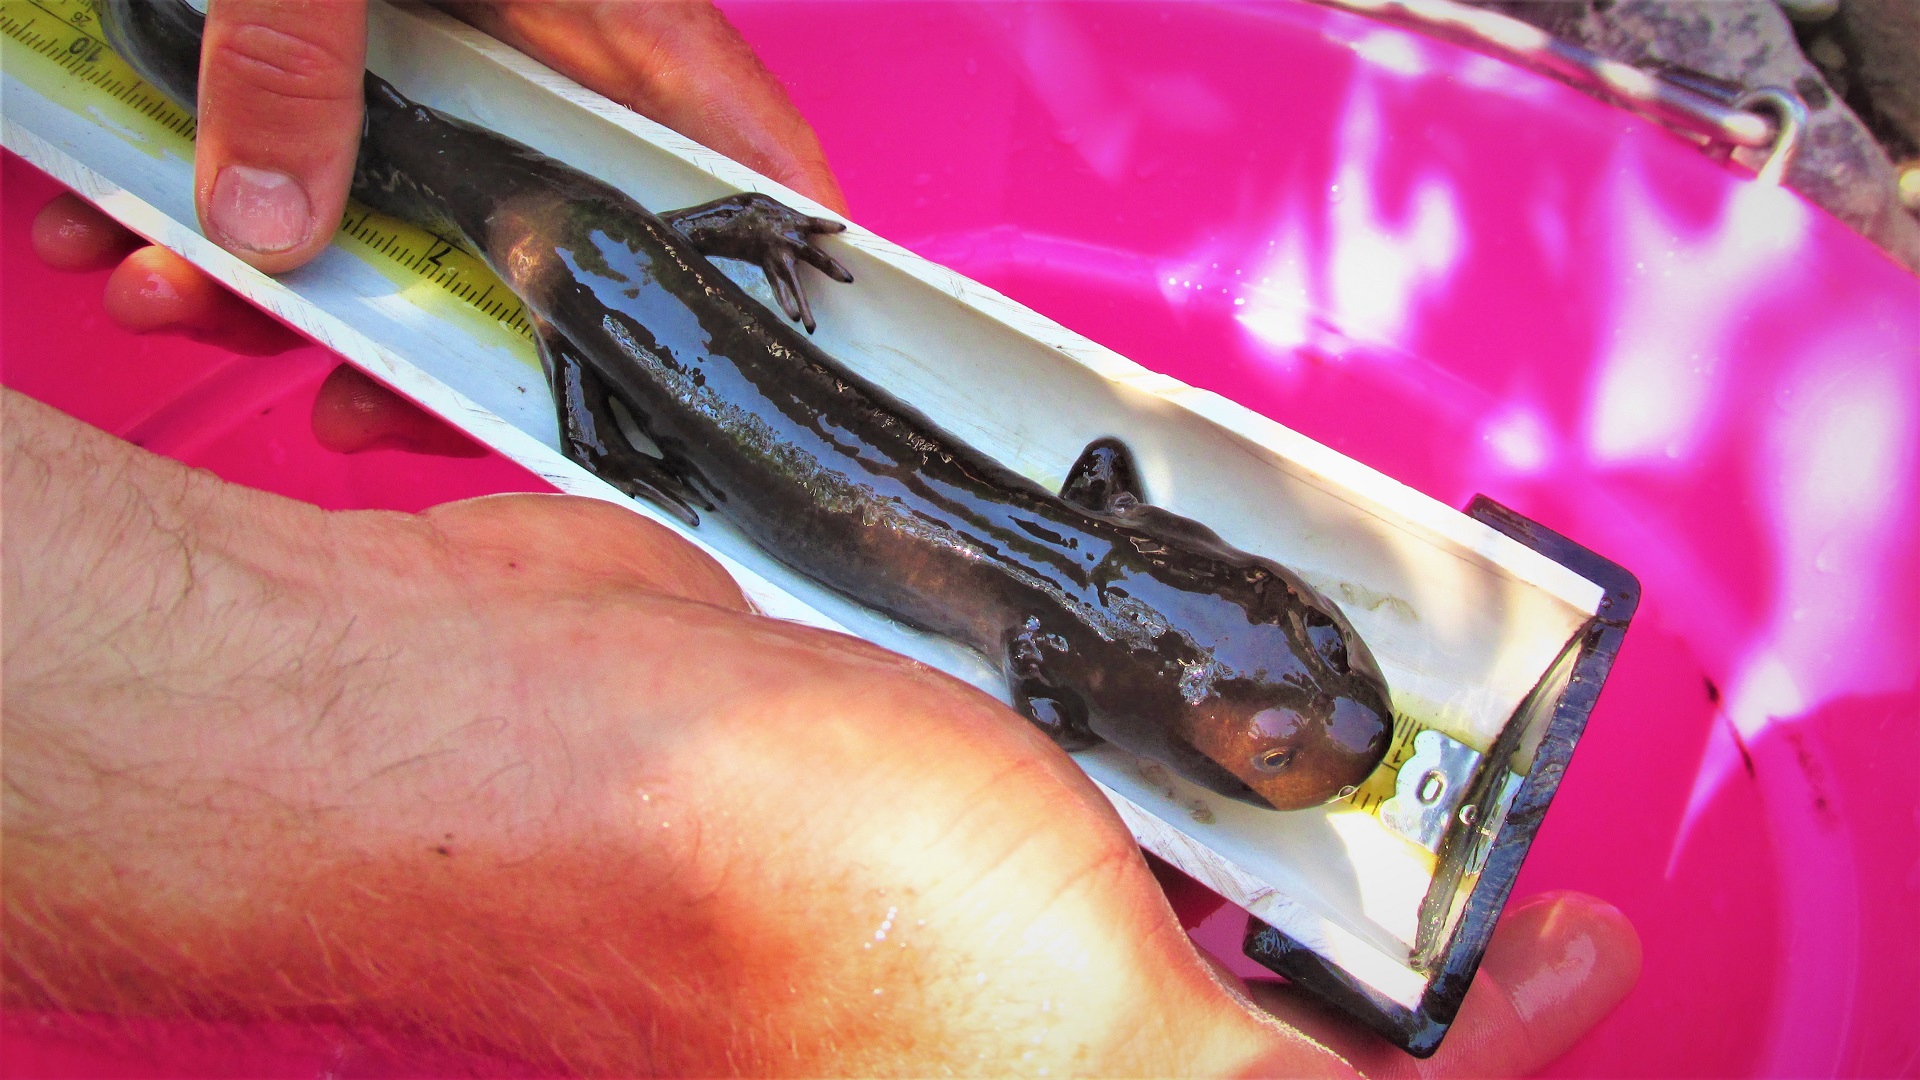
A Pacific giant salamander from Canyon Creek
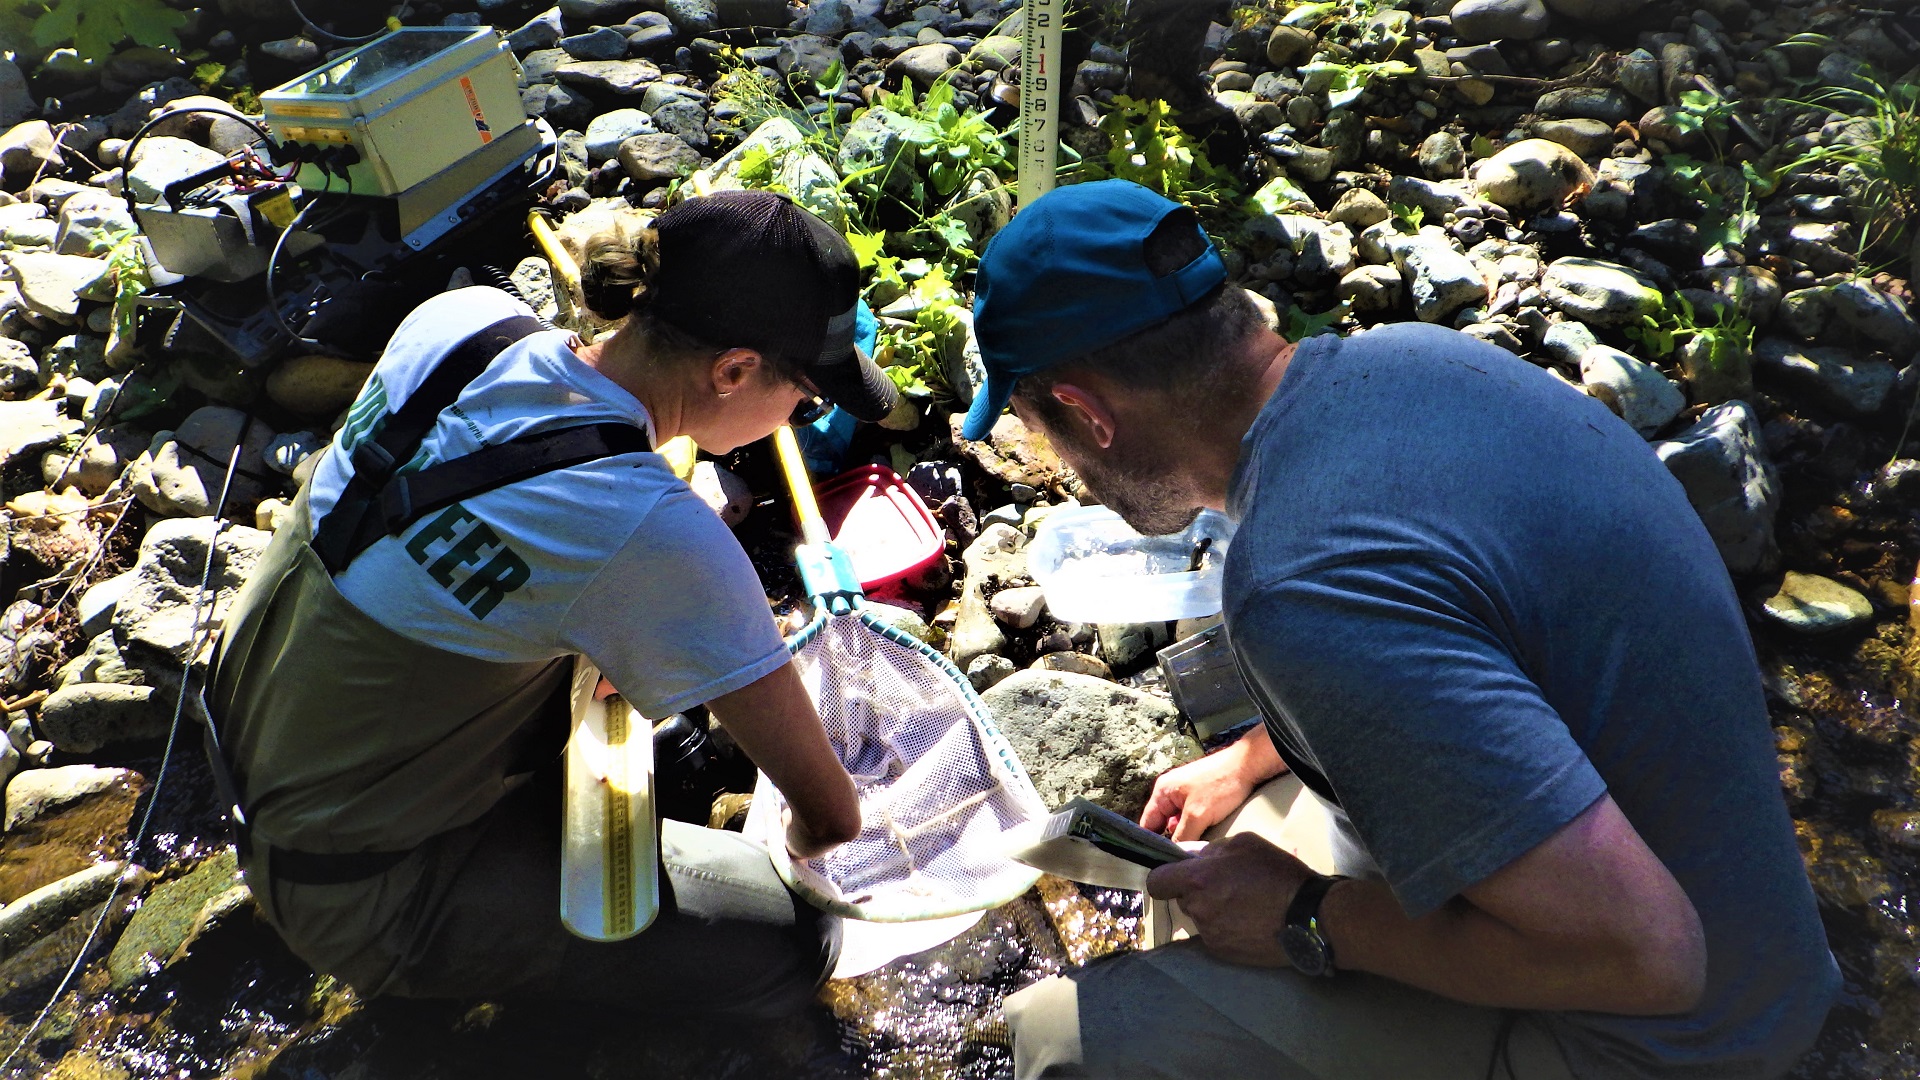
Crewmembers measure lengths and tally the size classes of each species.
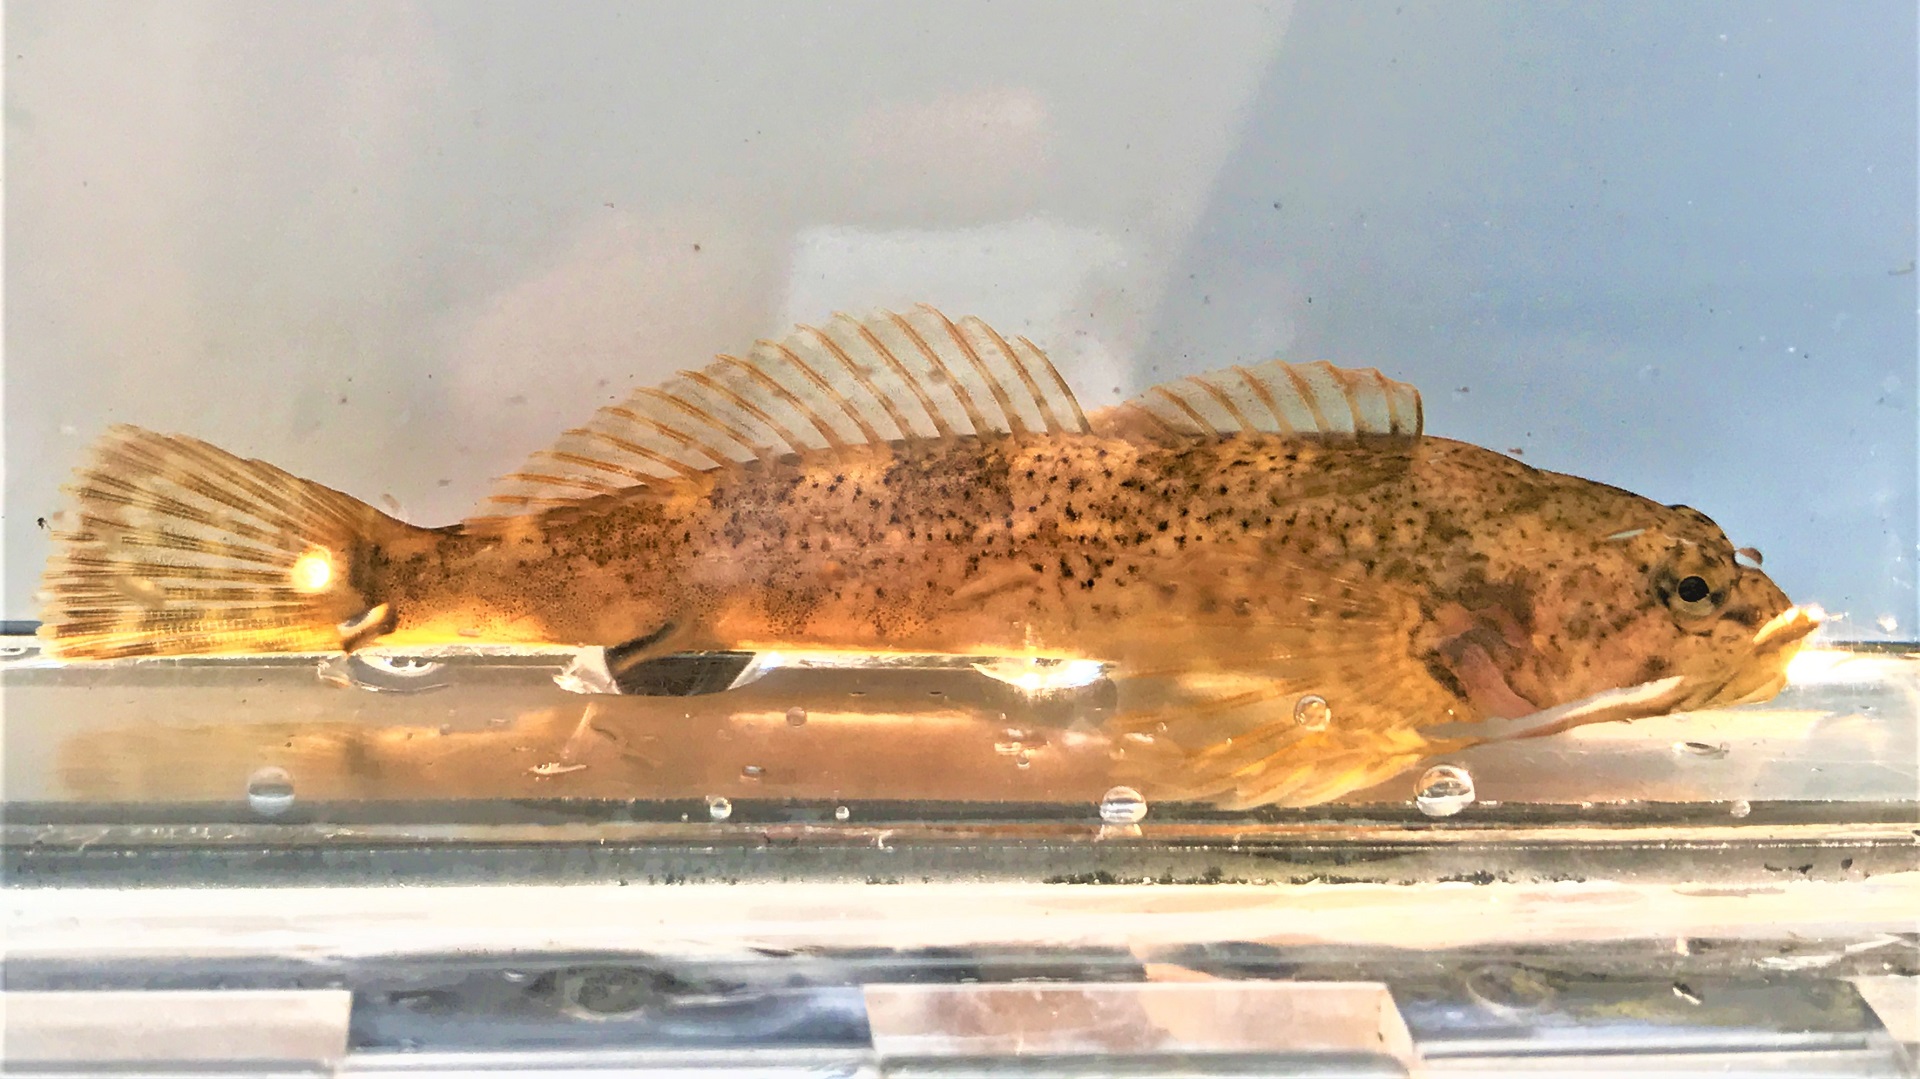
A closeup of a mottled sculpin.
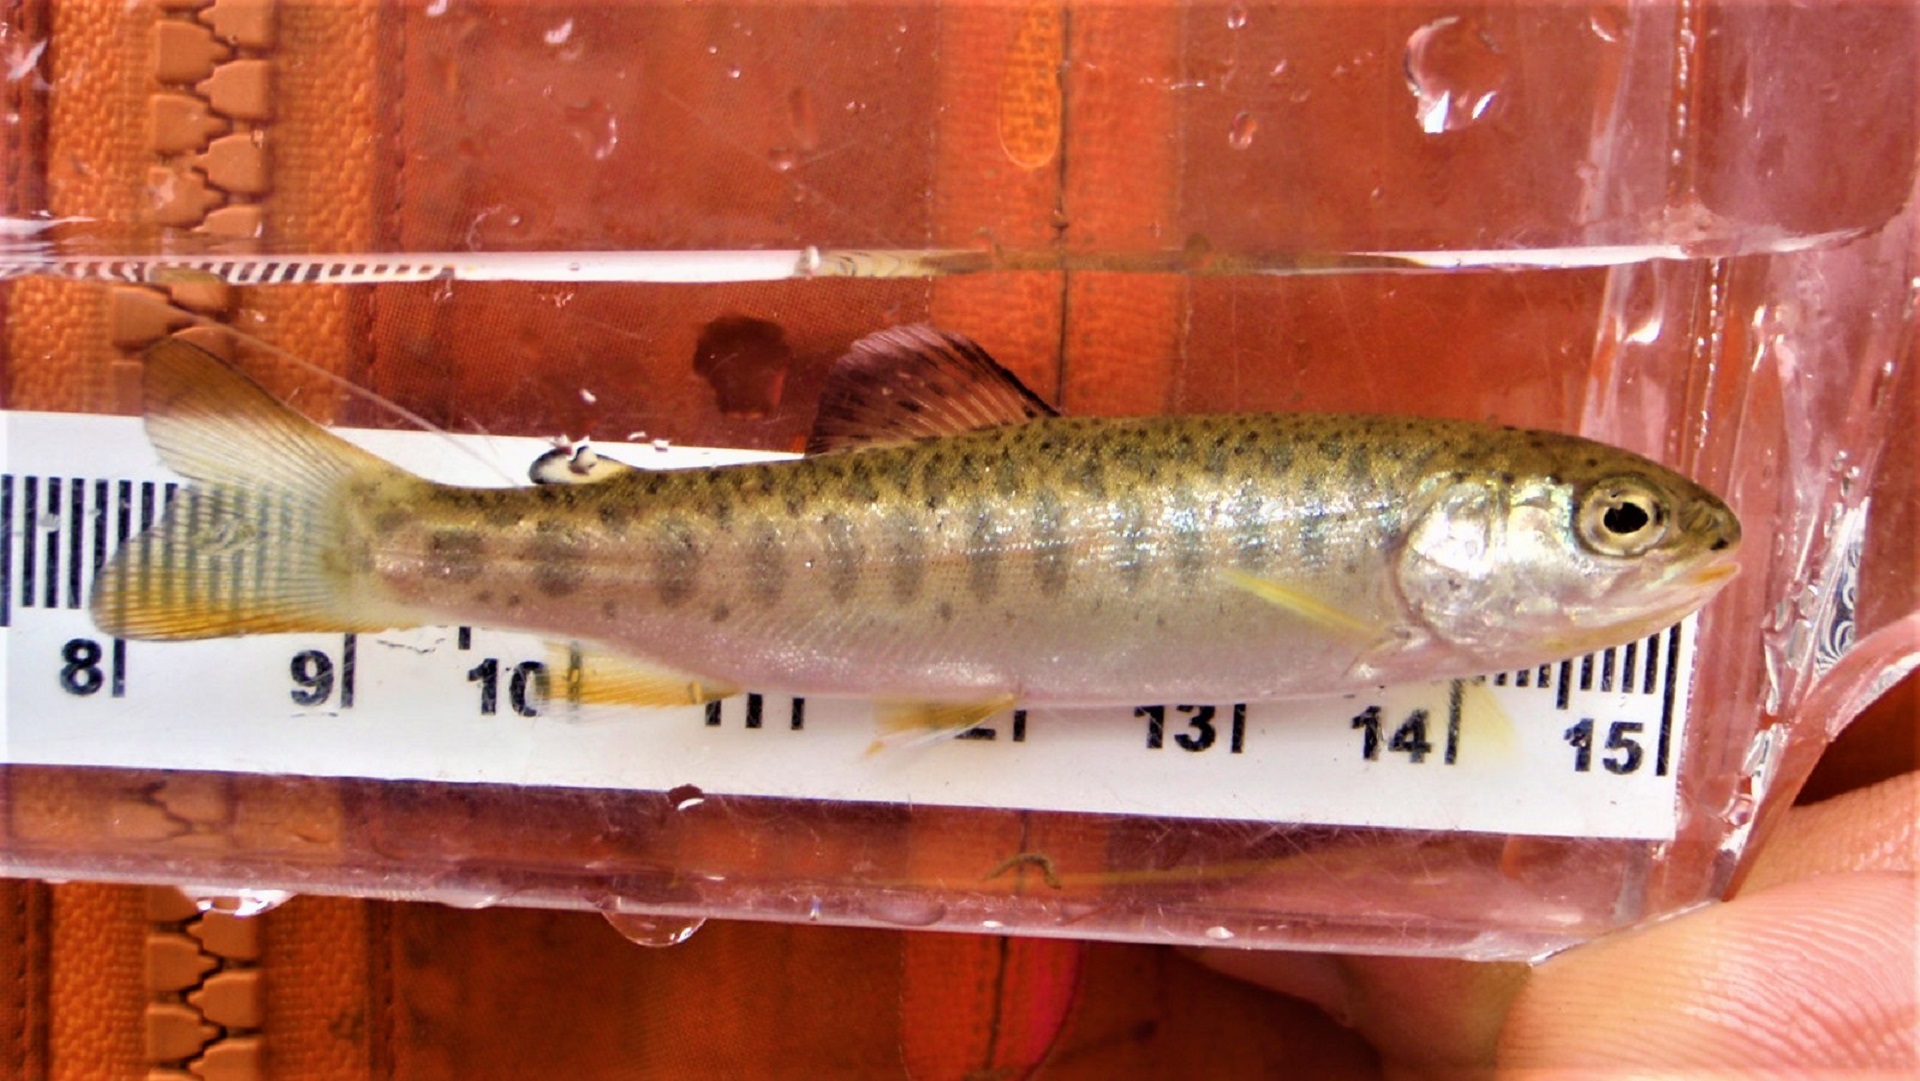
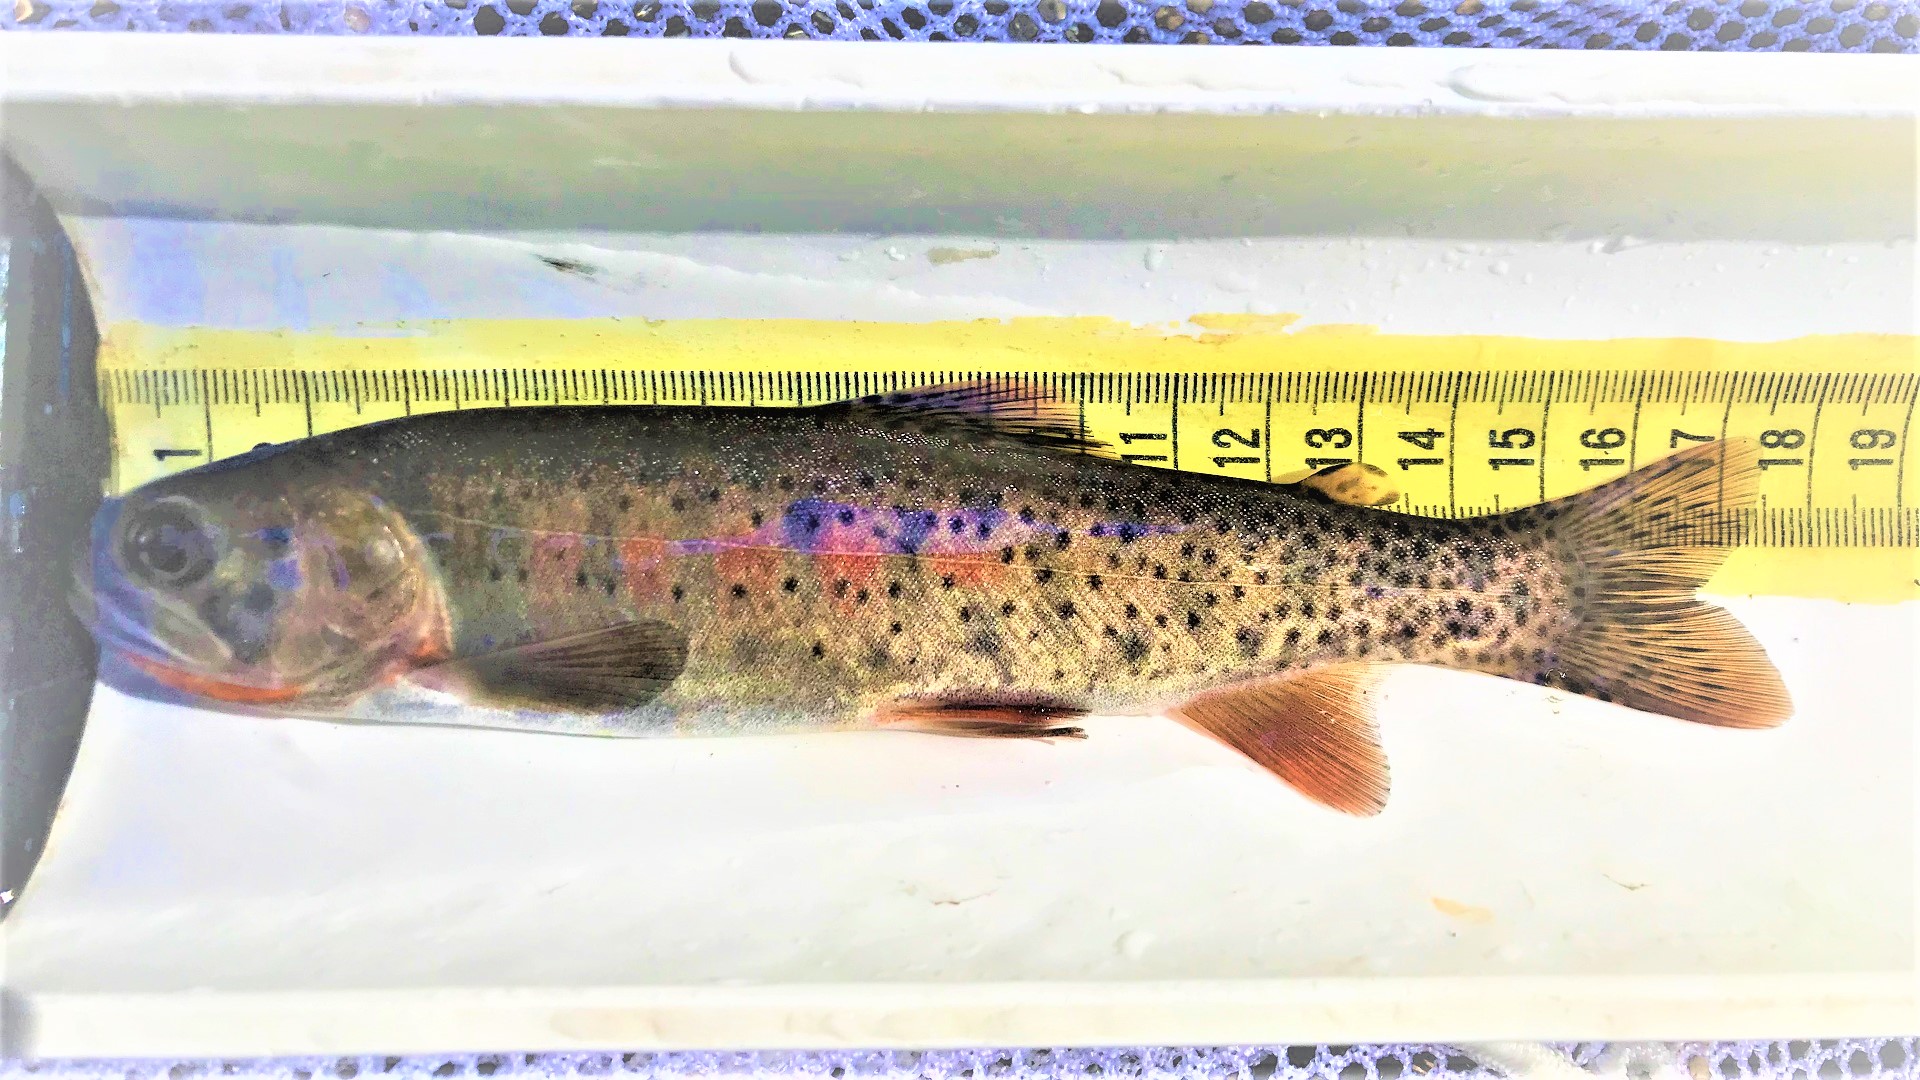
A beautiful juvenile rainbow trout from the Green River.
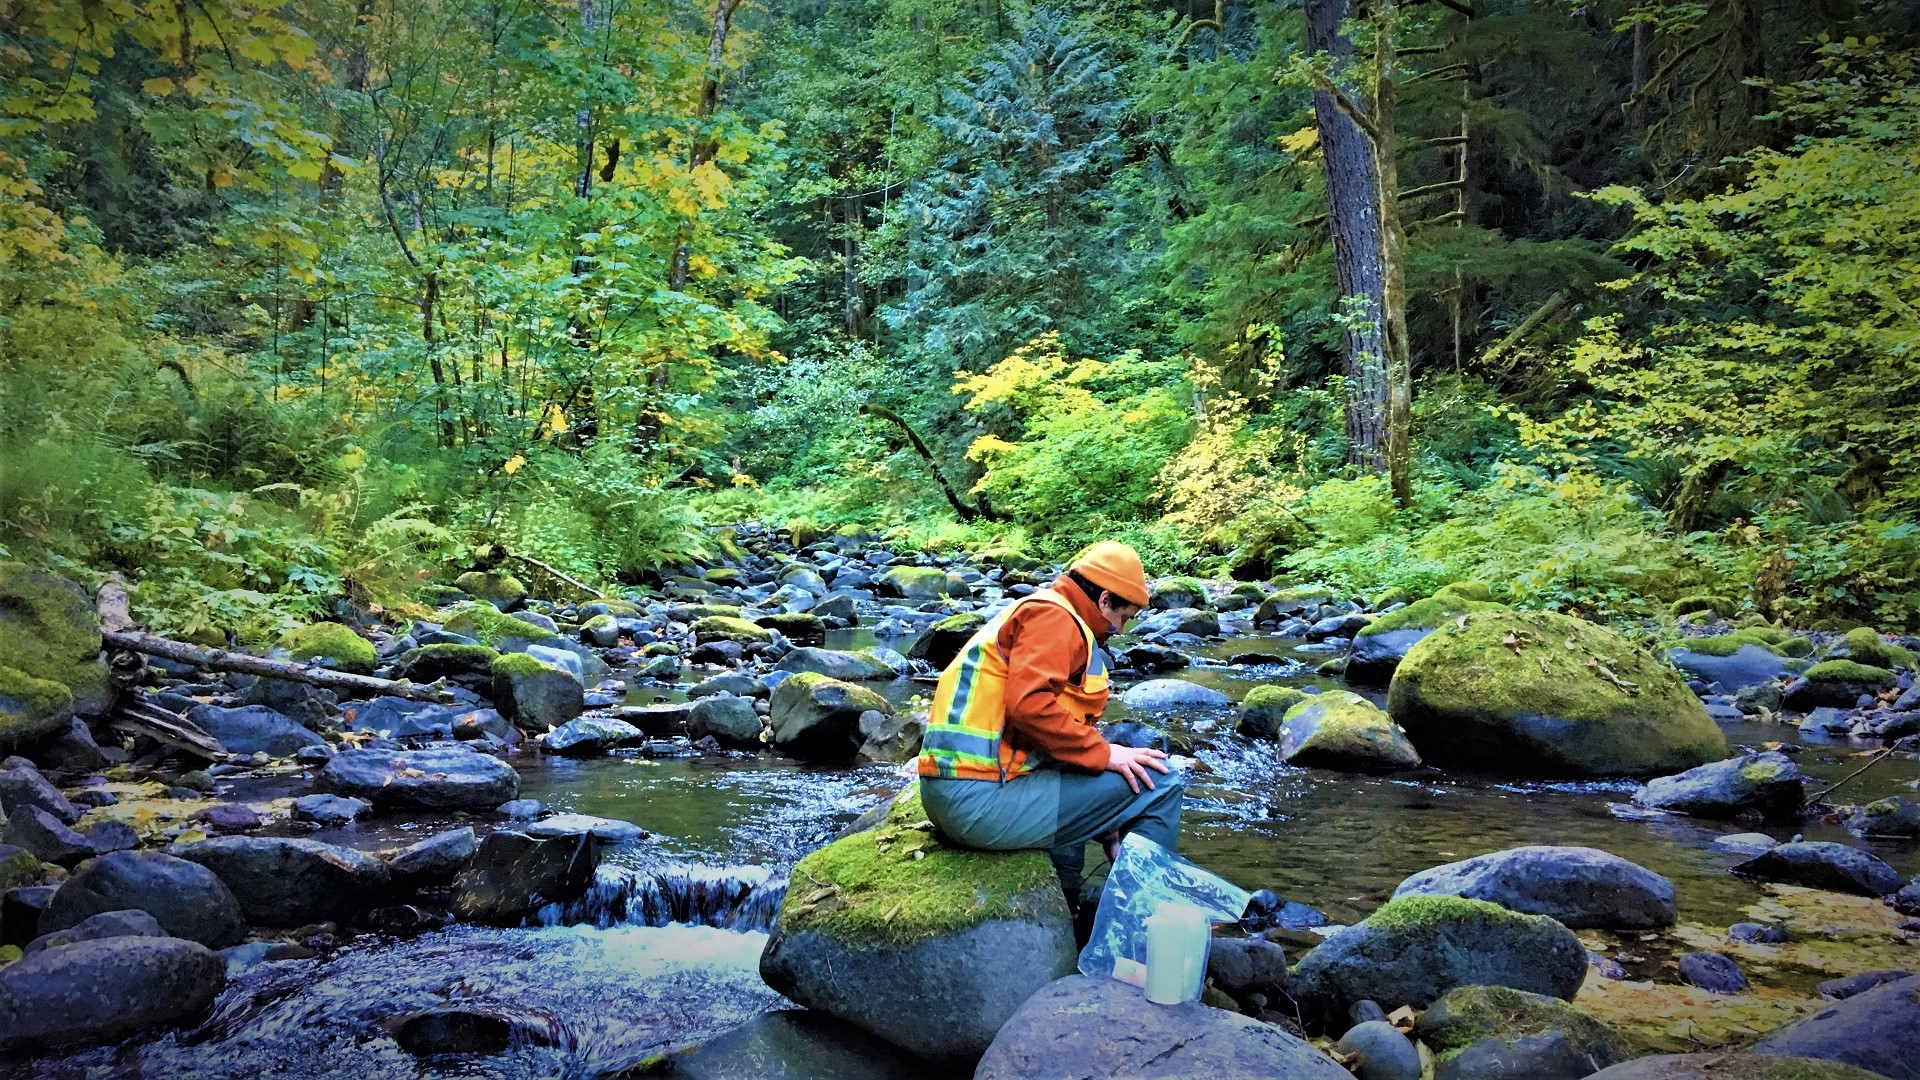
At each stream, crewmembers collect water quality samples.