

Watershed health — Puget Sound Region update
We investigated the health of stream habitats in the Puget Sound Status and Trends Region in 2009, 2013, and 2021. The region showed variable biological conditions, with physical and chemical indicators of stream substrate and water chemistry most often found in poor condition.
Use the map to navigate our reports by Status and Trends Region.
Regional summary
- Benthic Index of Biotic Integrity scores for the Puget Sound Region show positive trends in biological health from sampling completed in 2009, 2013, and 2021.
- In 2009, 2013, and 2021, the most prevalent stressors for streams in the Puget Sound Region were poor relative bed stability, low dissolved oxygen, elevated sand/fines percentages, and elevated nitrogen concentrations.
Biological condition
The invertebrate biological condition of streams, as assessed with B-IBI scores, changed significantly from 2009 to 2013. The changes in scores were less significant between 2013 and 2021, though the percentage of stream length classified as good in 2013 was reduced in 2021.
This does not indicate a significant decrease in stream health for this region, but we will be watching these trends as this region experiences more urbanization.
We used B-IBI ratings from 2009, 2013, and 2021 to obtain the percentage of stream kilometers in good, fair, and poor conditions for the Puget Sound Region. Error bars represent 95% confidence.
Physical and chemical indicators
The Puget Sound Region has been sampled three times, giving us much more insight on trends in this region. The indicators for this region were categorized into "Physcial Indicators" and "Chemical Indicators." Click the corresponding boxes on the graph below to view each category.
Physical indicators, like bed stability, percentage of sands or fines, average embeddedness, and residual pool depth, showed similar trends of poor conditions over time. Notably, the percentage of stream kilometers indicating poor bed stability was over 80 percent for 2009, 2013, and 2023.
Chemical indicators showed slightly more variable trends, with slight decreases of stream kilometers in poor condition. Low amounts of dissolved oxygen and high nitrogen levels indicated poor conditions for over 40percent of stream kilometers in all three sampling years.
To interact with this graph and learn more about these physiochemical indicators, hold your mouse over each bar.
This interactive graph shows the percentage of stream kilometers assessed with poor physiochemical conditions in the Puget Sound Region for 2009, 2013, and 2021. The x-axis represents the percentage of river extent in poor condition. Error bars show 95% confidence intervals.
Flip through our field photos!
This large woody debris is part of a restoration project on the North Fork of the Nooksack River.
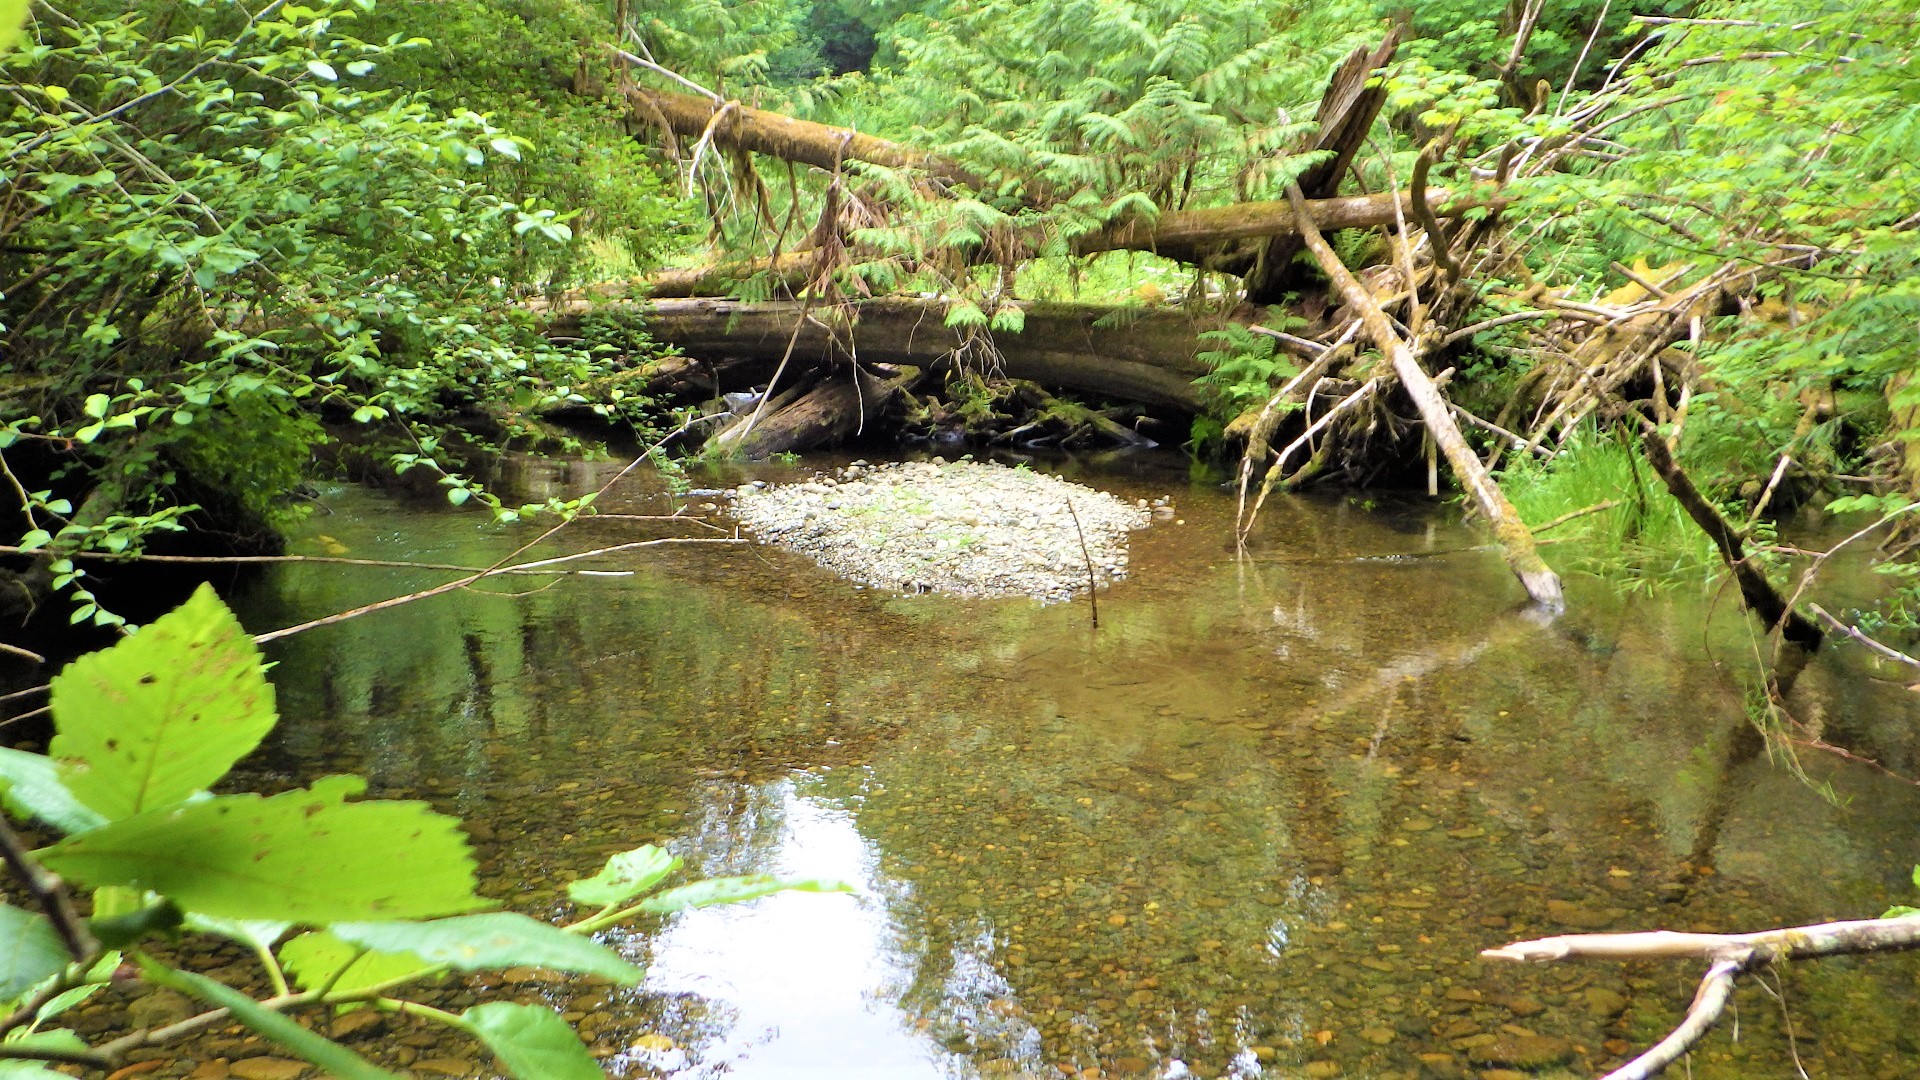
This stream has good fish habitat, including cover from boulders, mosses, and woody debris.
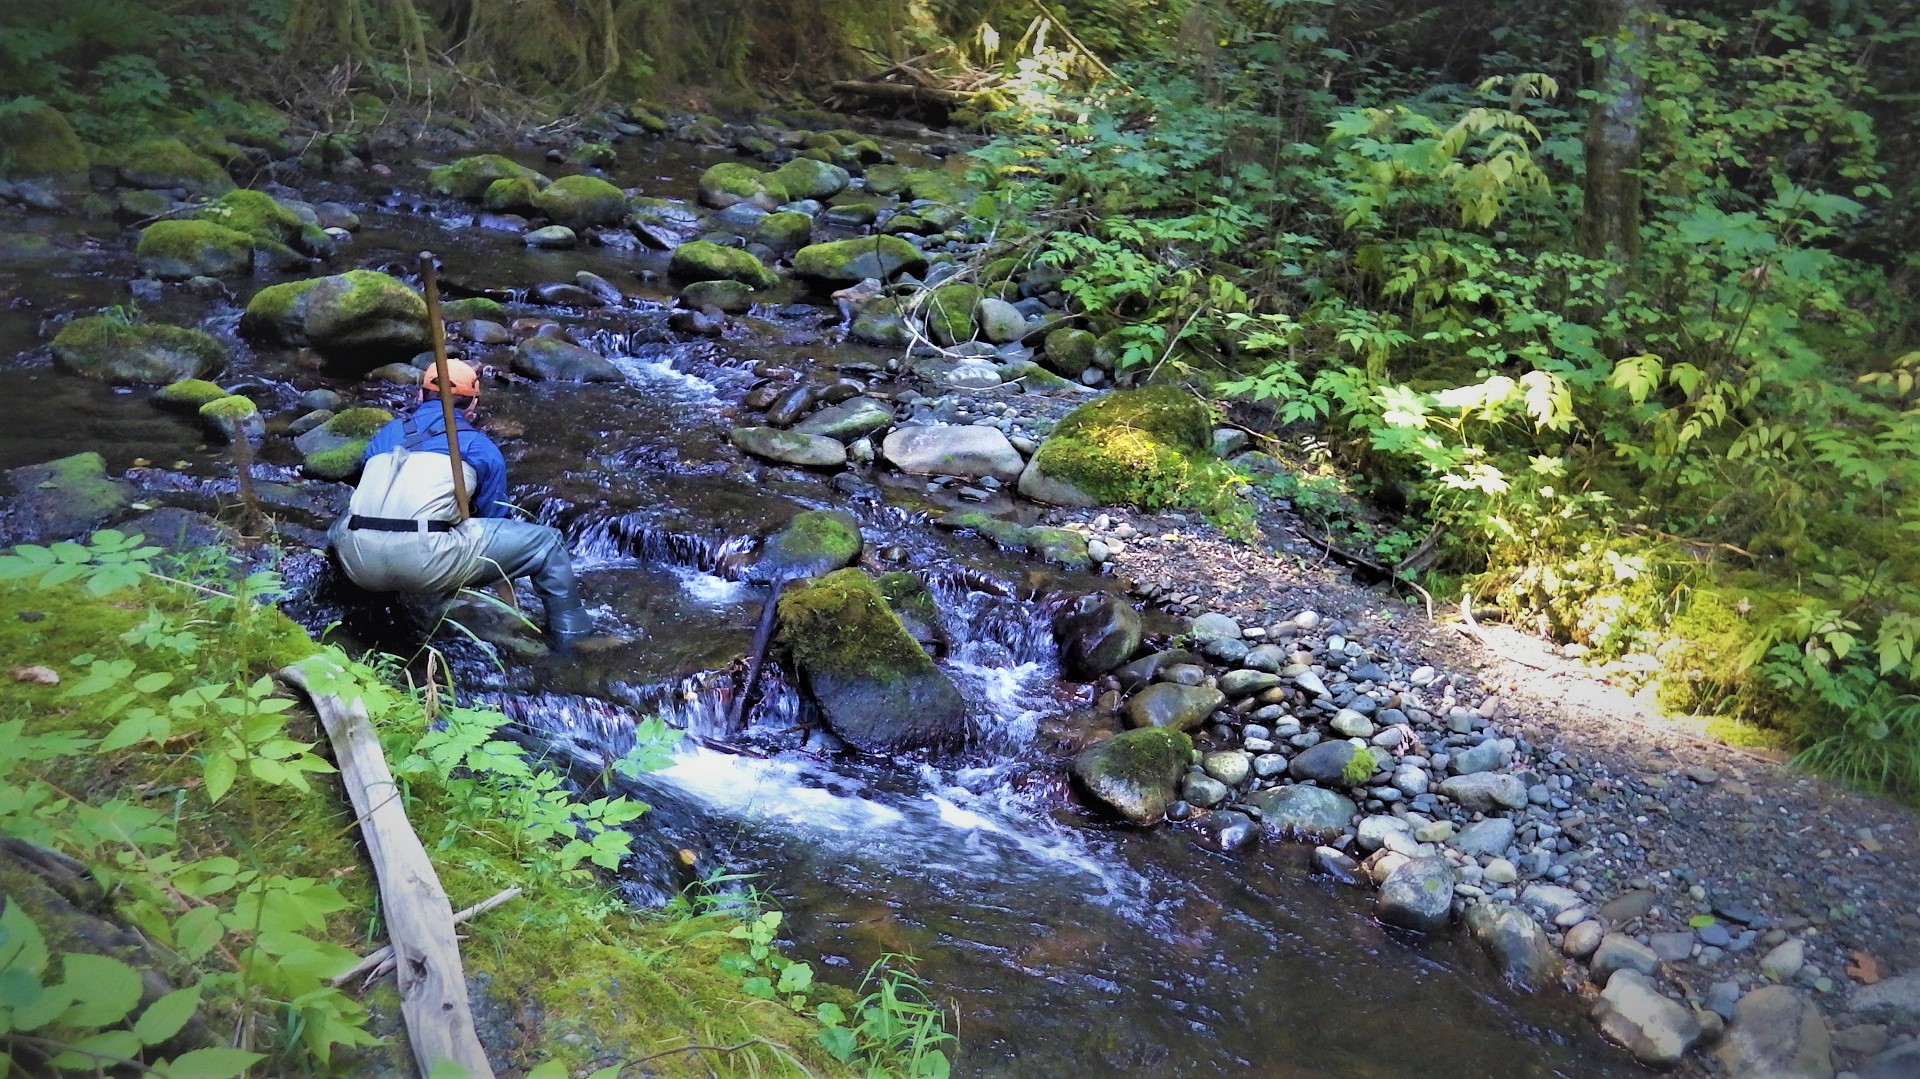
Crewmembers collect macroinvertebrates at each site using a sampling net.
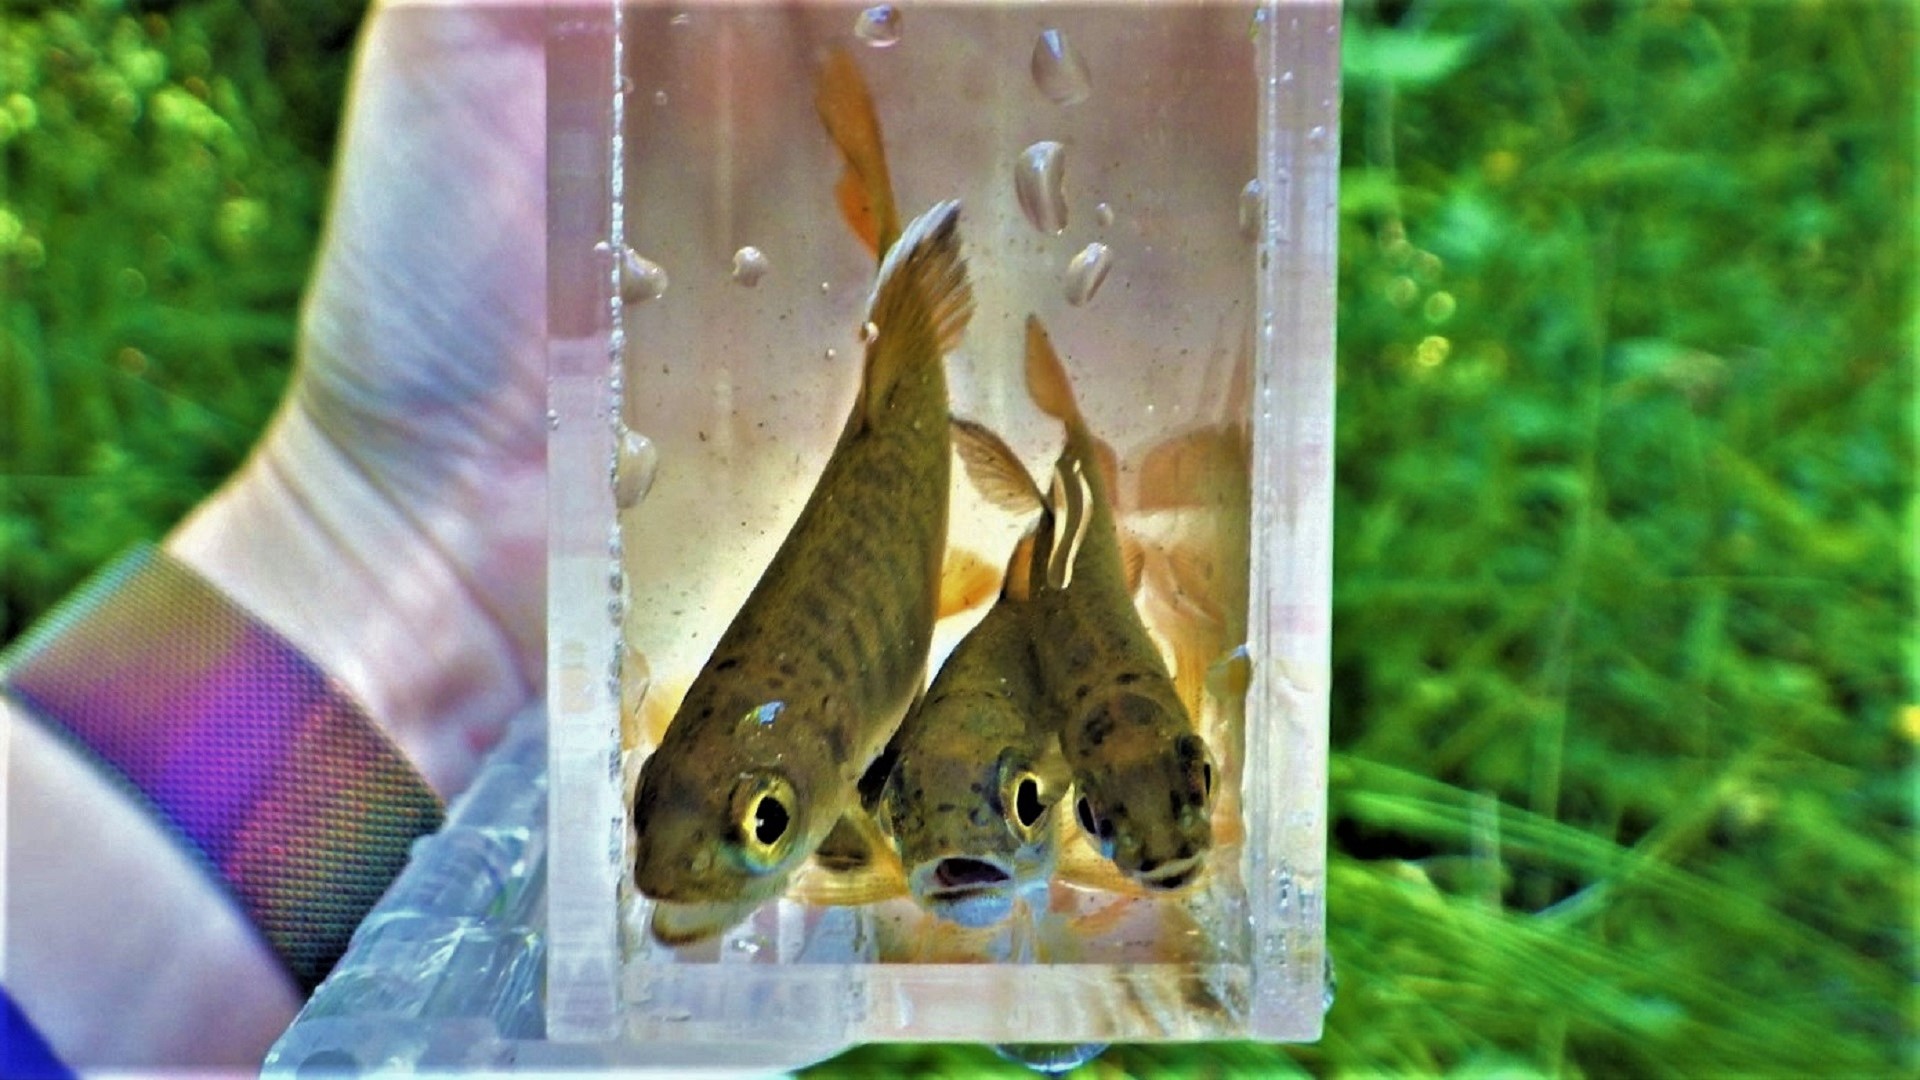
The Hamma Hamma River has good habitat and calm backwater areas where these juvenile Coho salmon can thrive.
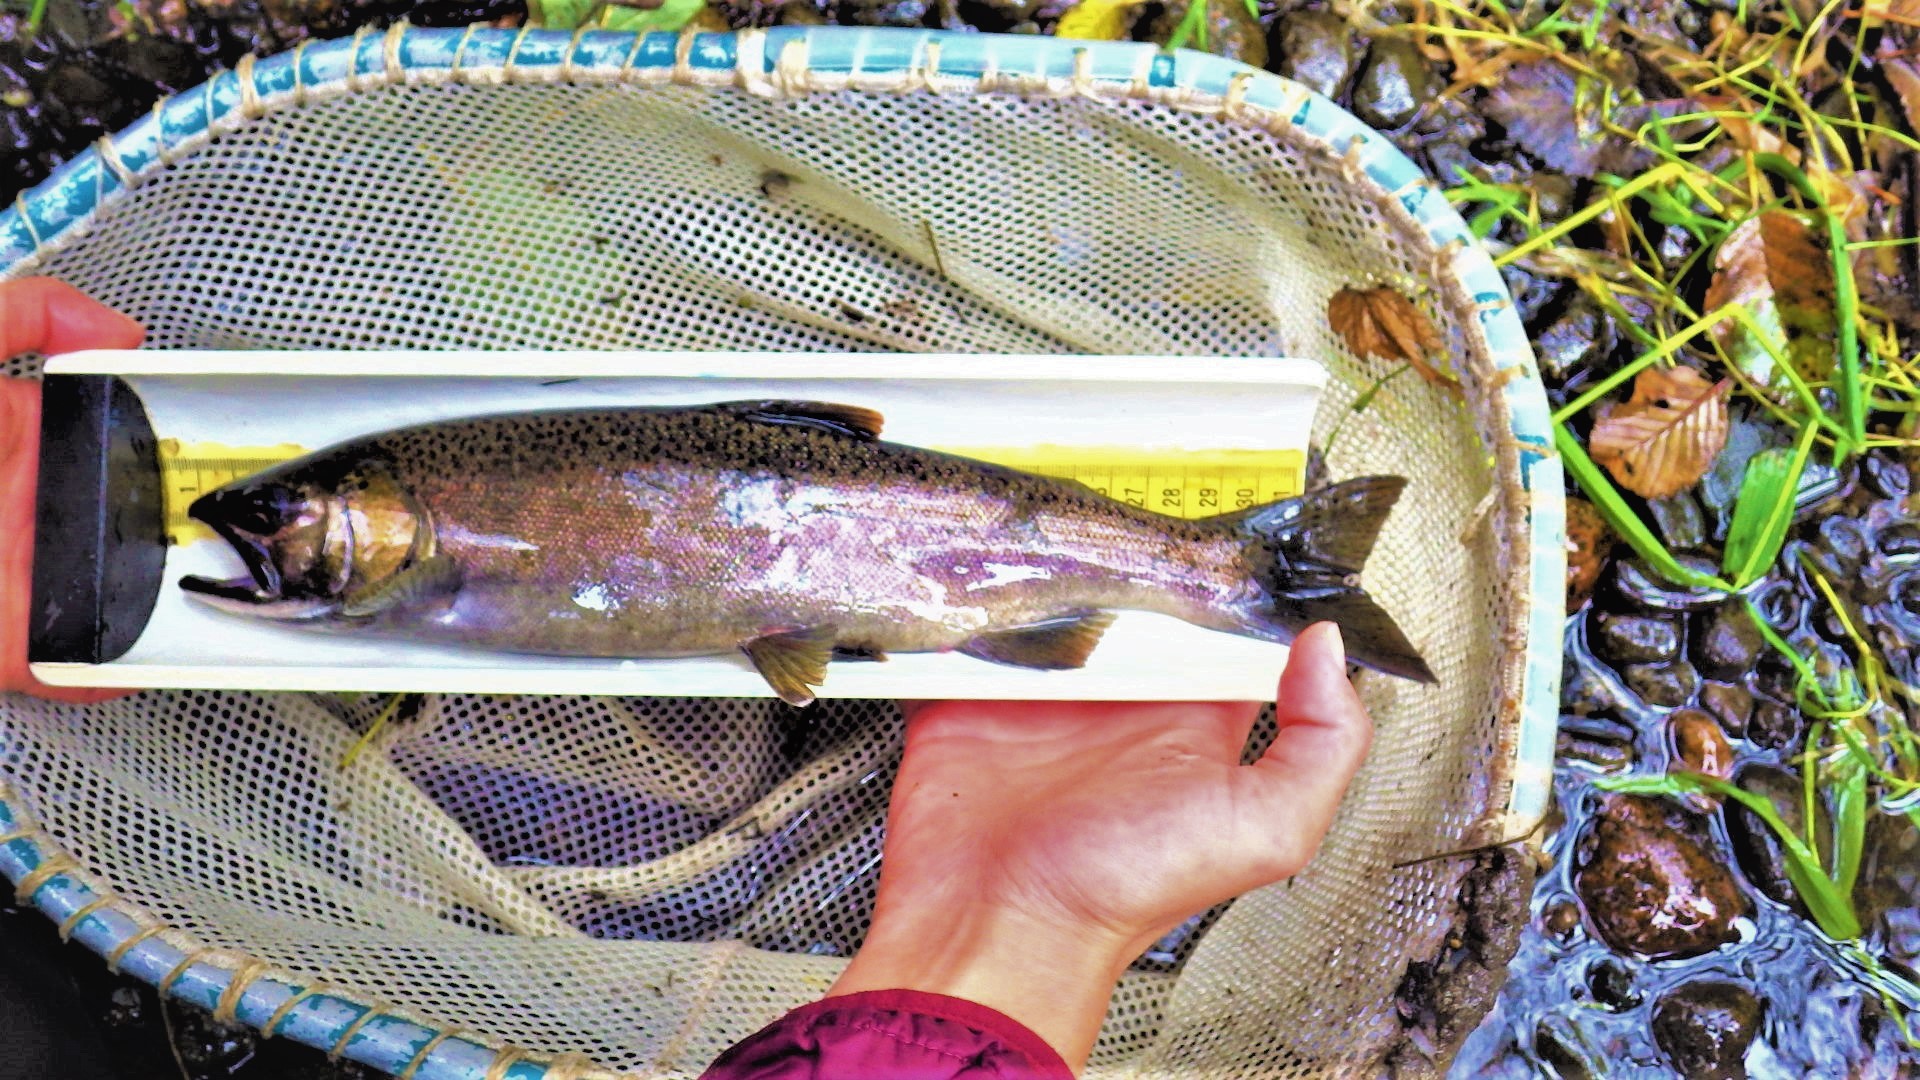
An adult Coho salmon from Thorndyke Creek indicates clean, cold water and good fish habitat.
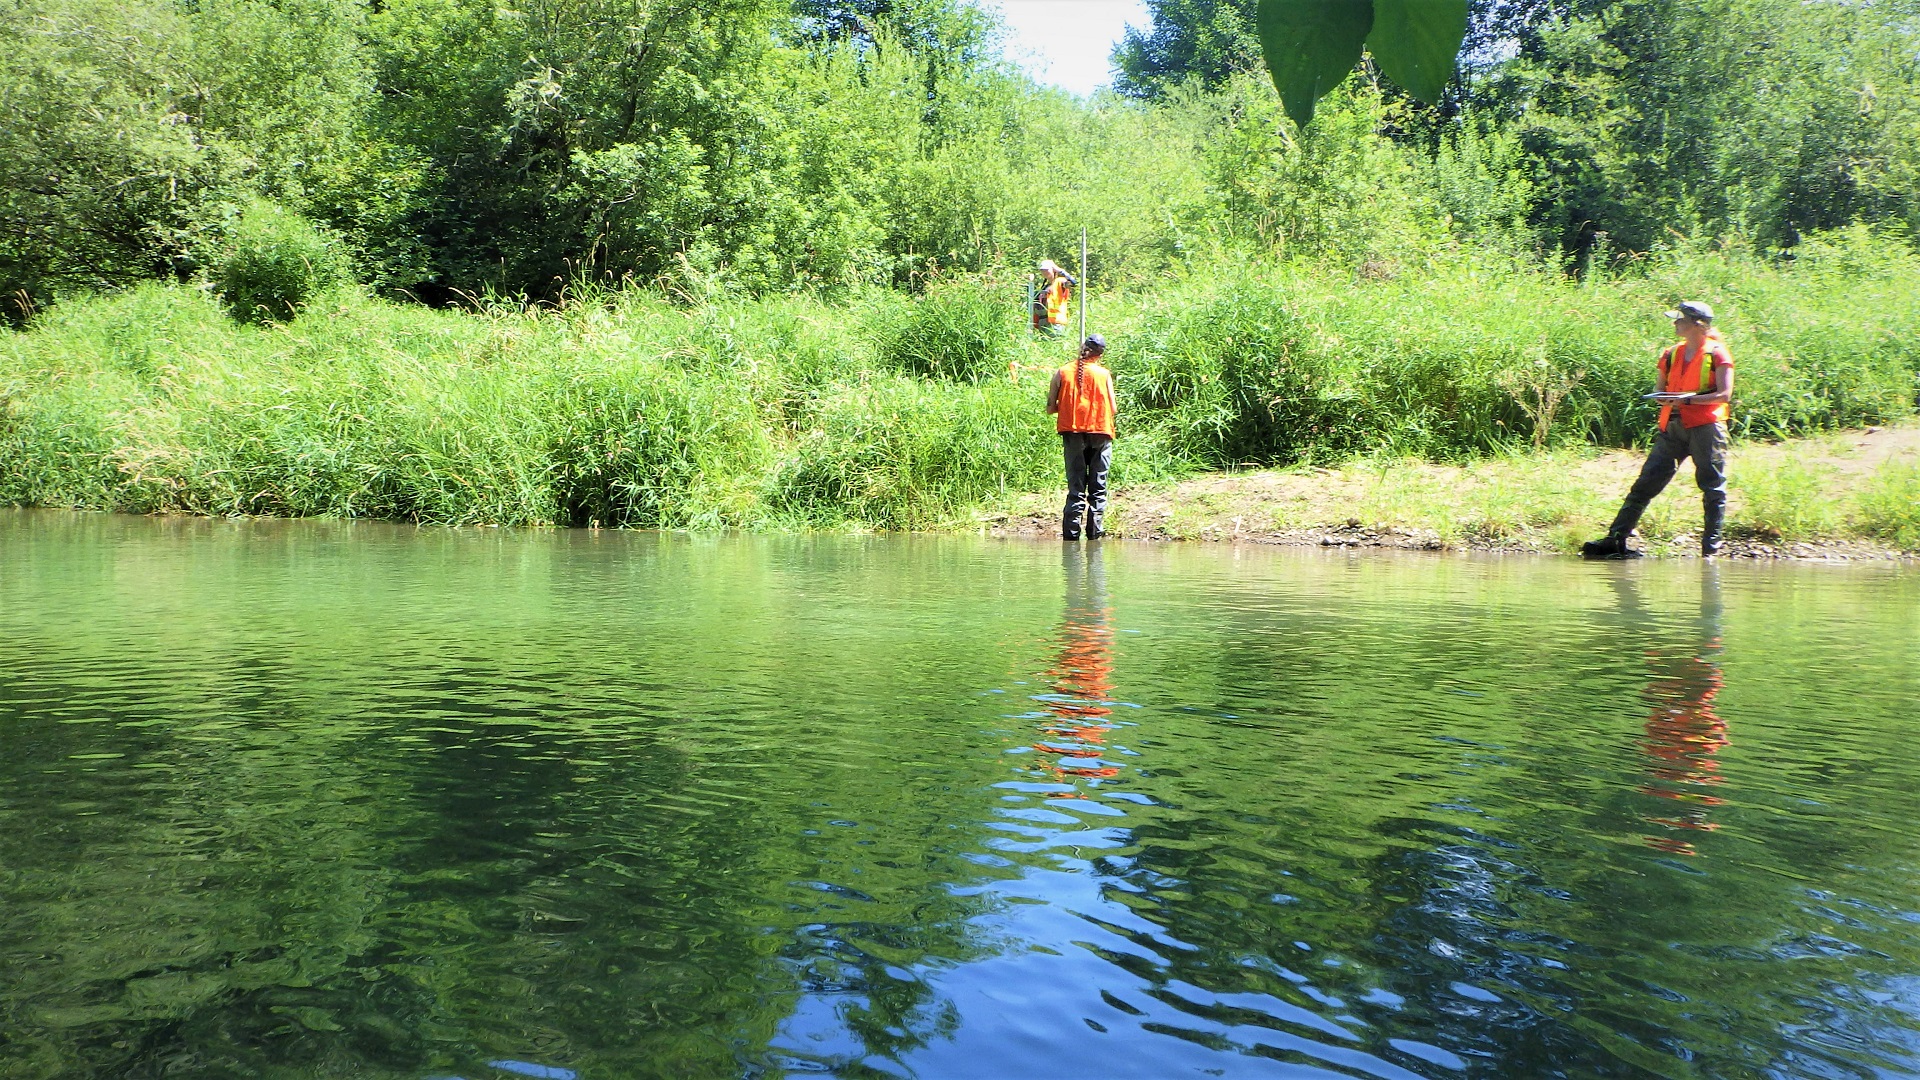
Measuring bankful heights on larger rivers can be challenging, requiring multiple crew members.
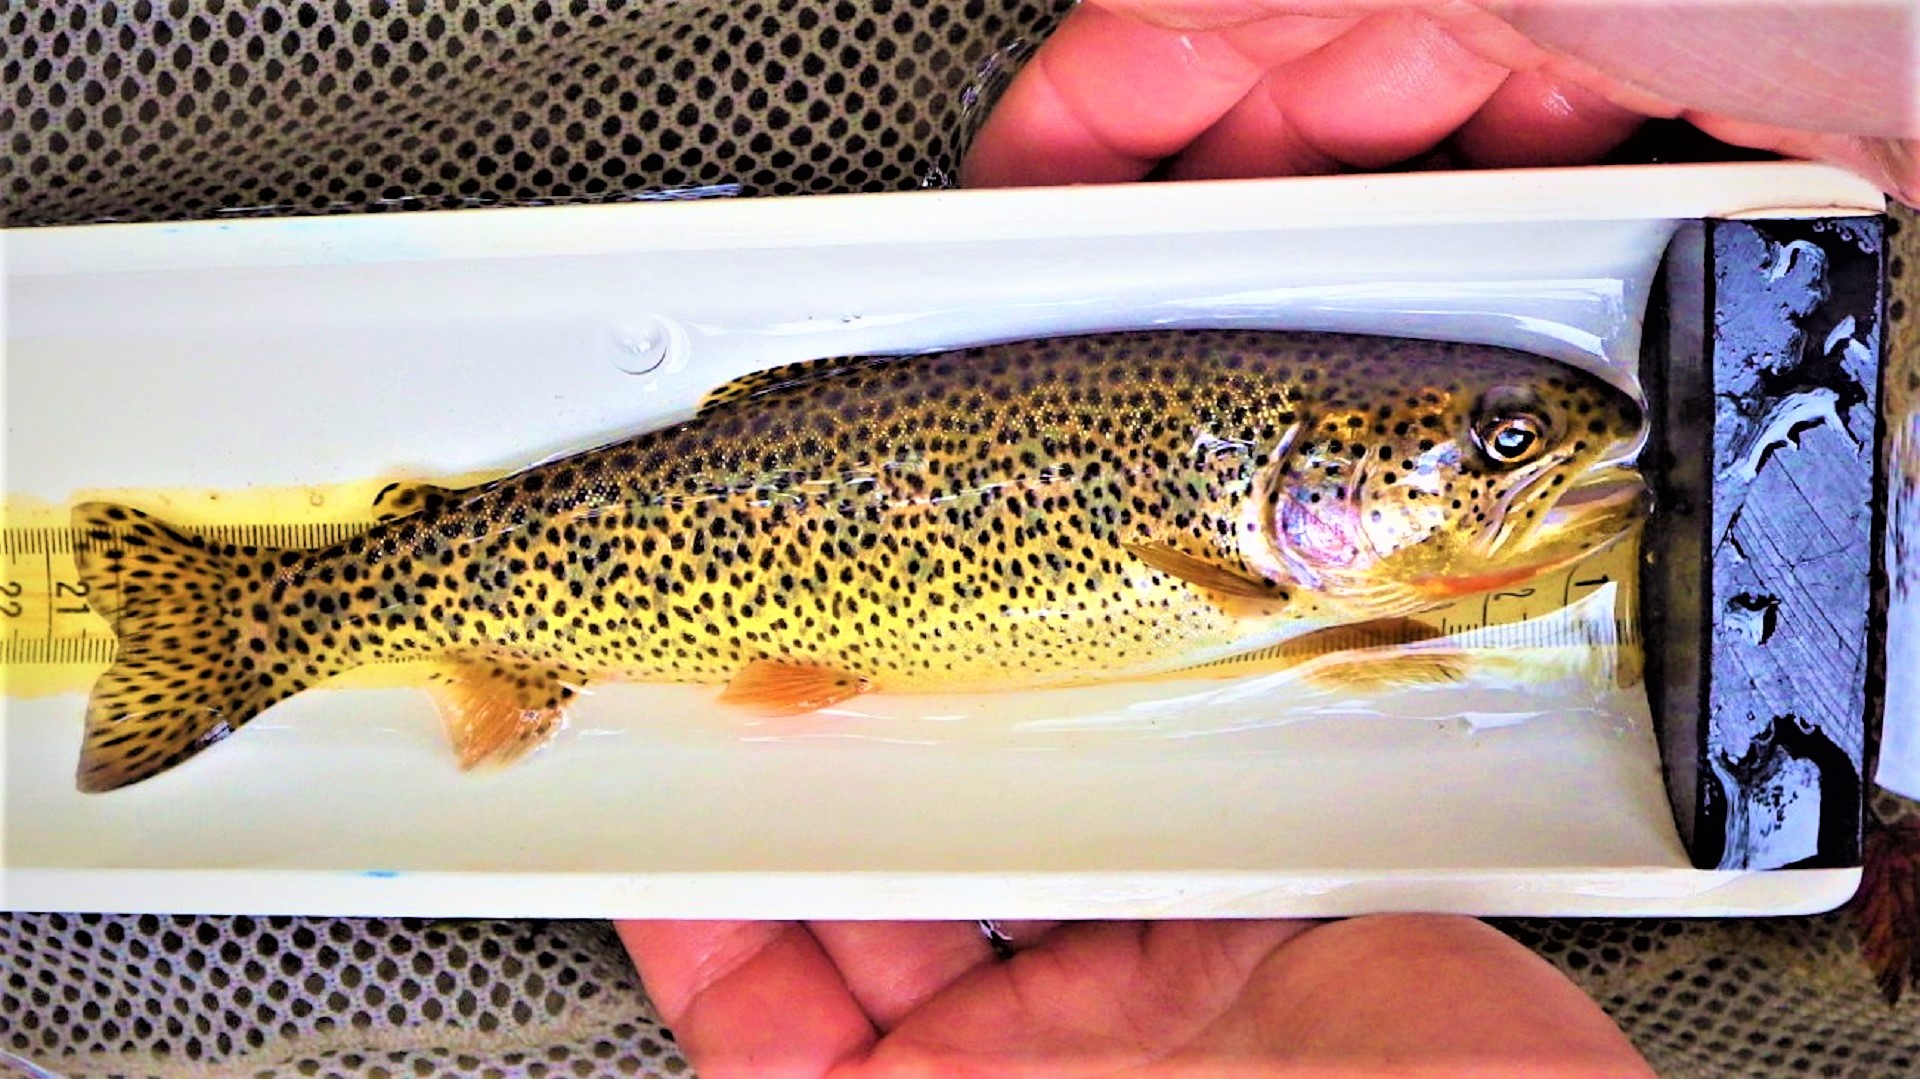
A cutthroat trout from Thorndyke Creek indicates clean, clear, well-oxygenated water.
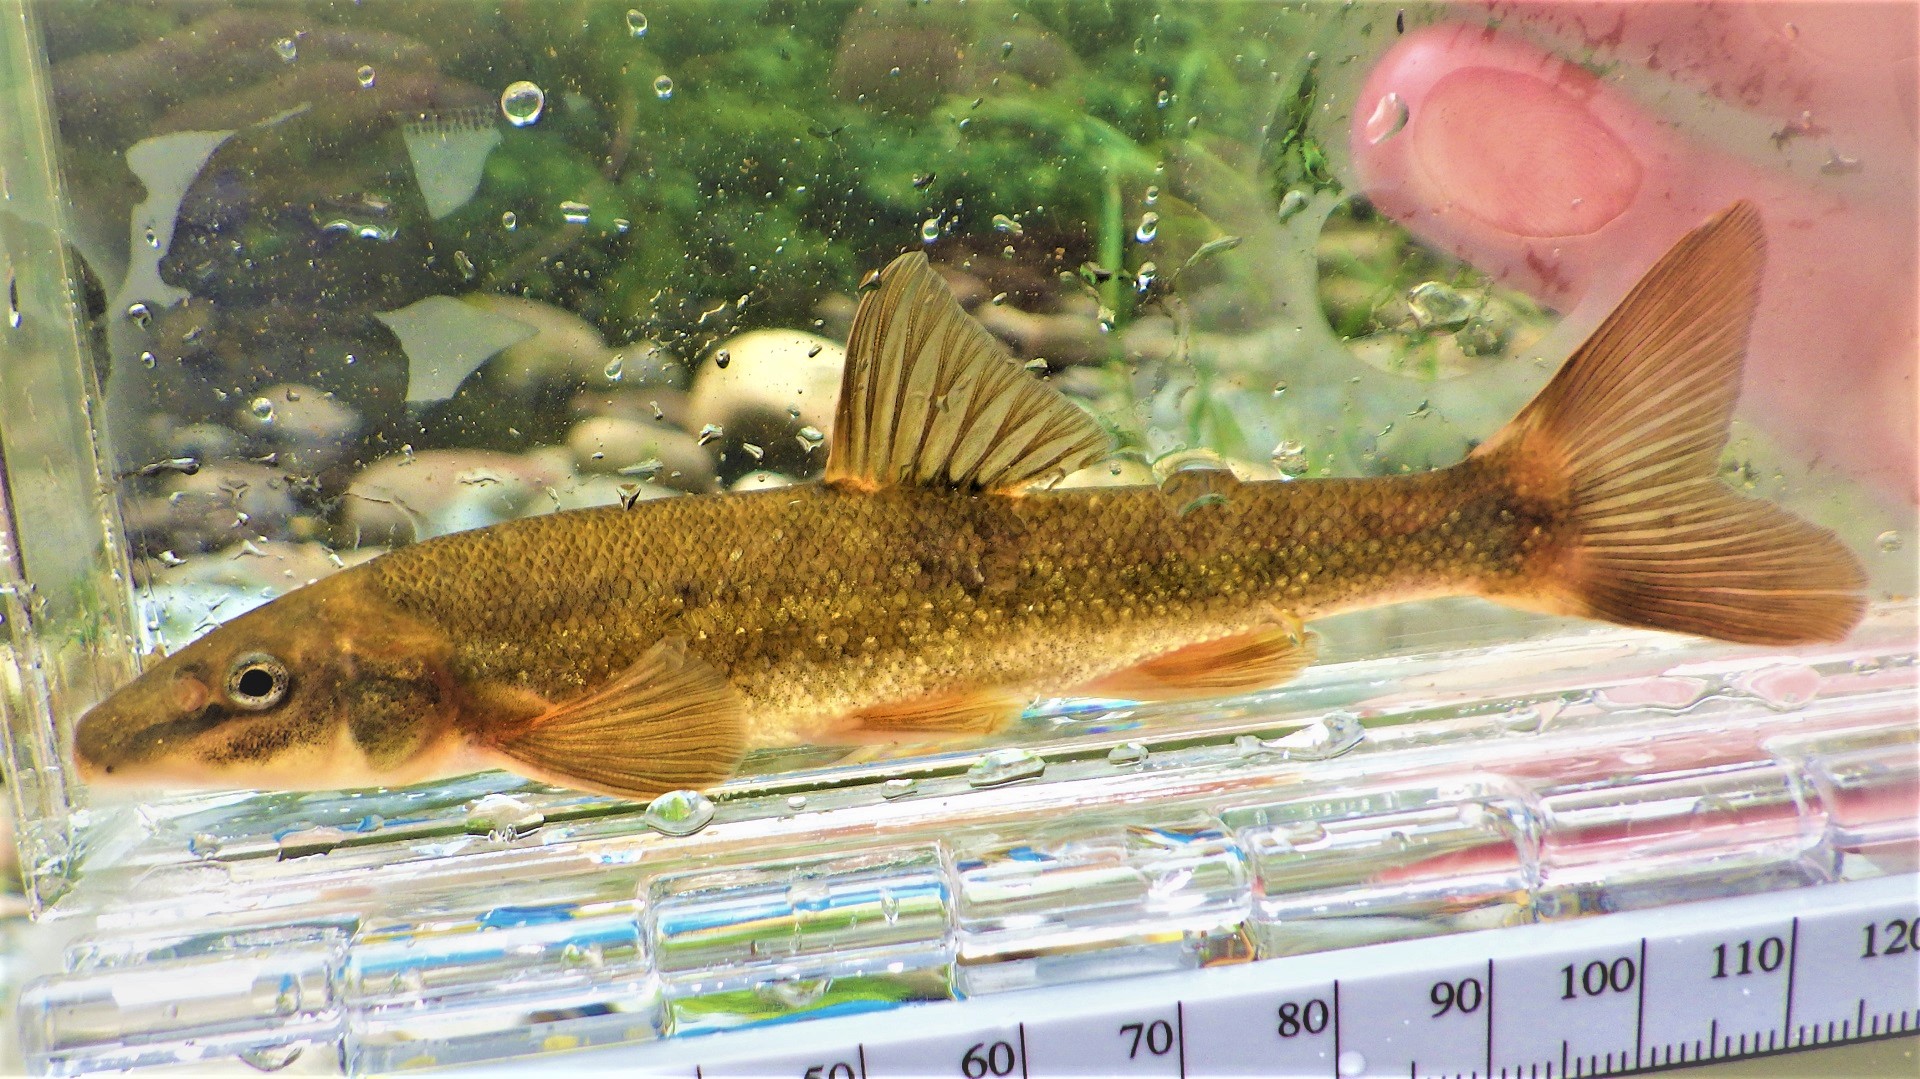
A sparkly longnose dace from the Griffin Creek indicates a healthy stream.
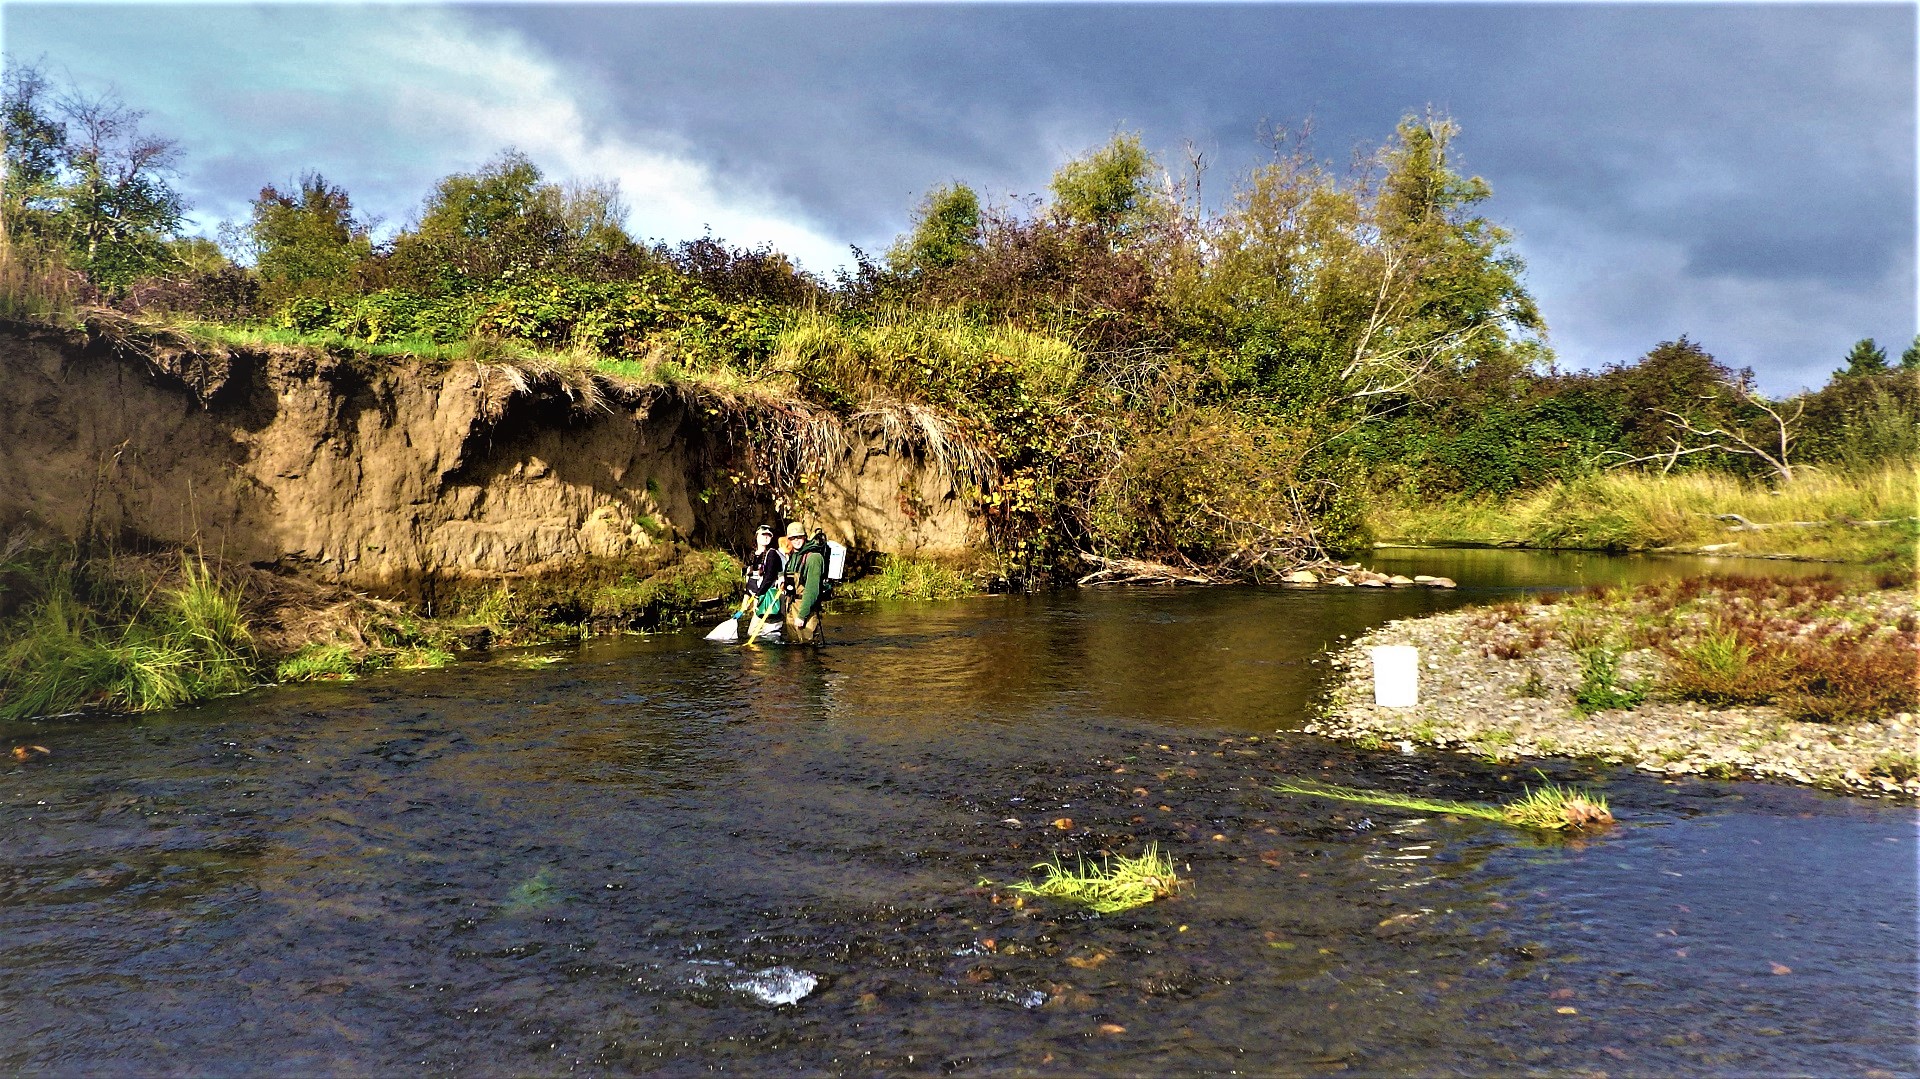
The electrofishing crew performs single pass surveys on larger rivers and streams.
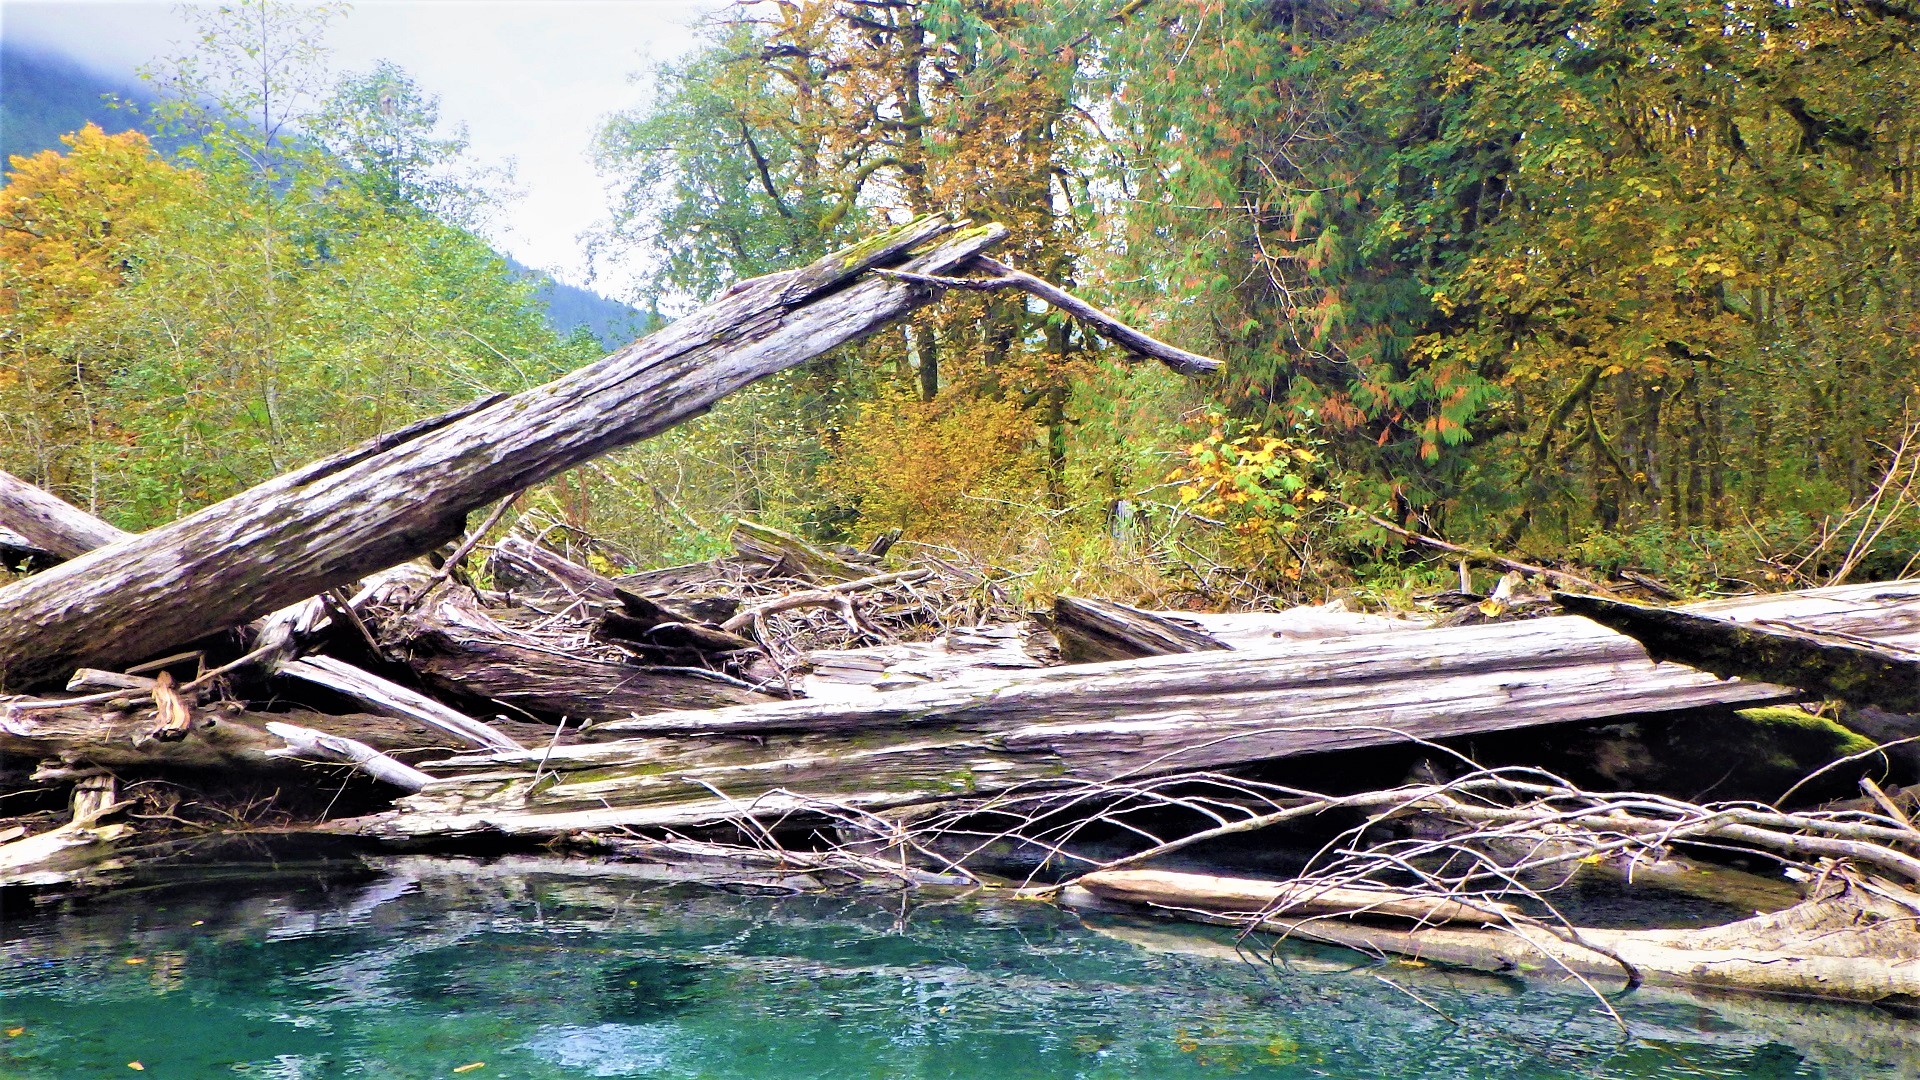
Large woody debris slows water in streams, creating deep pools and fish cover at Hamma Hamma River.
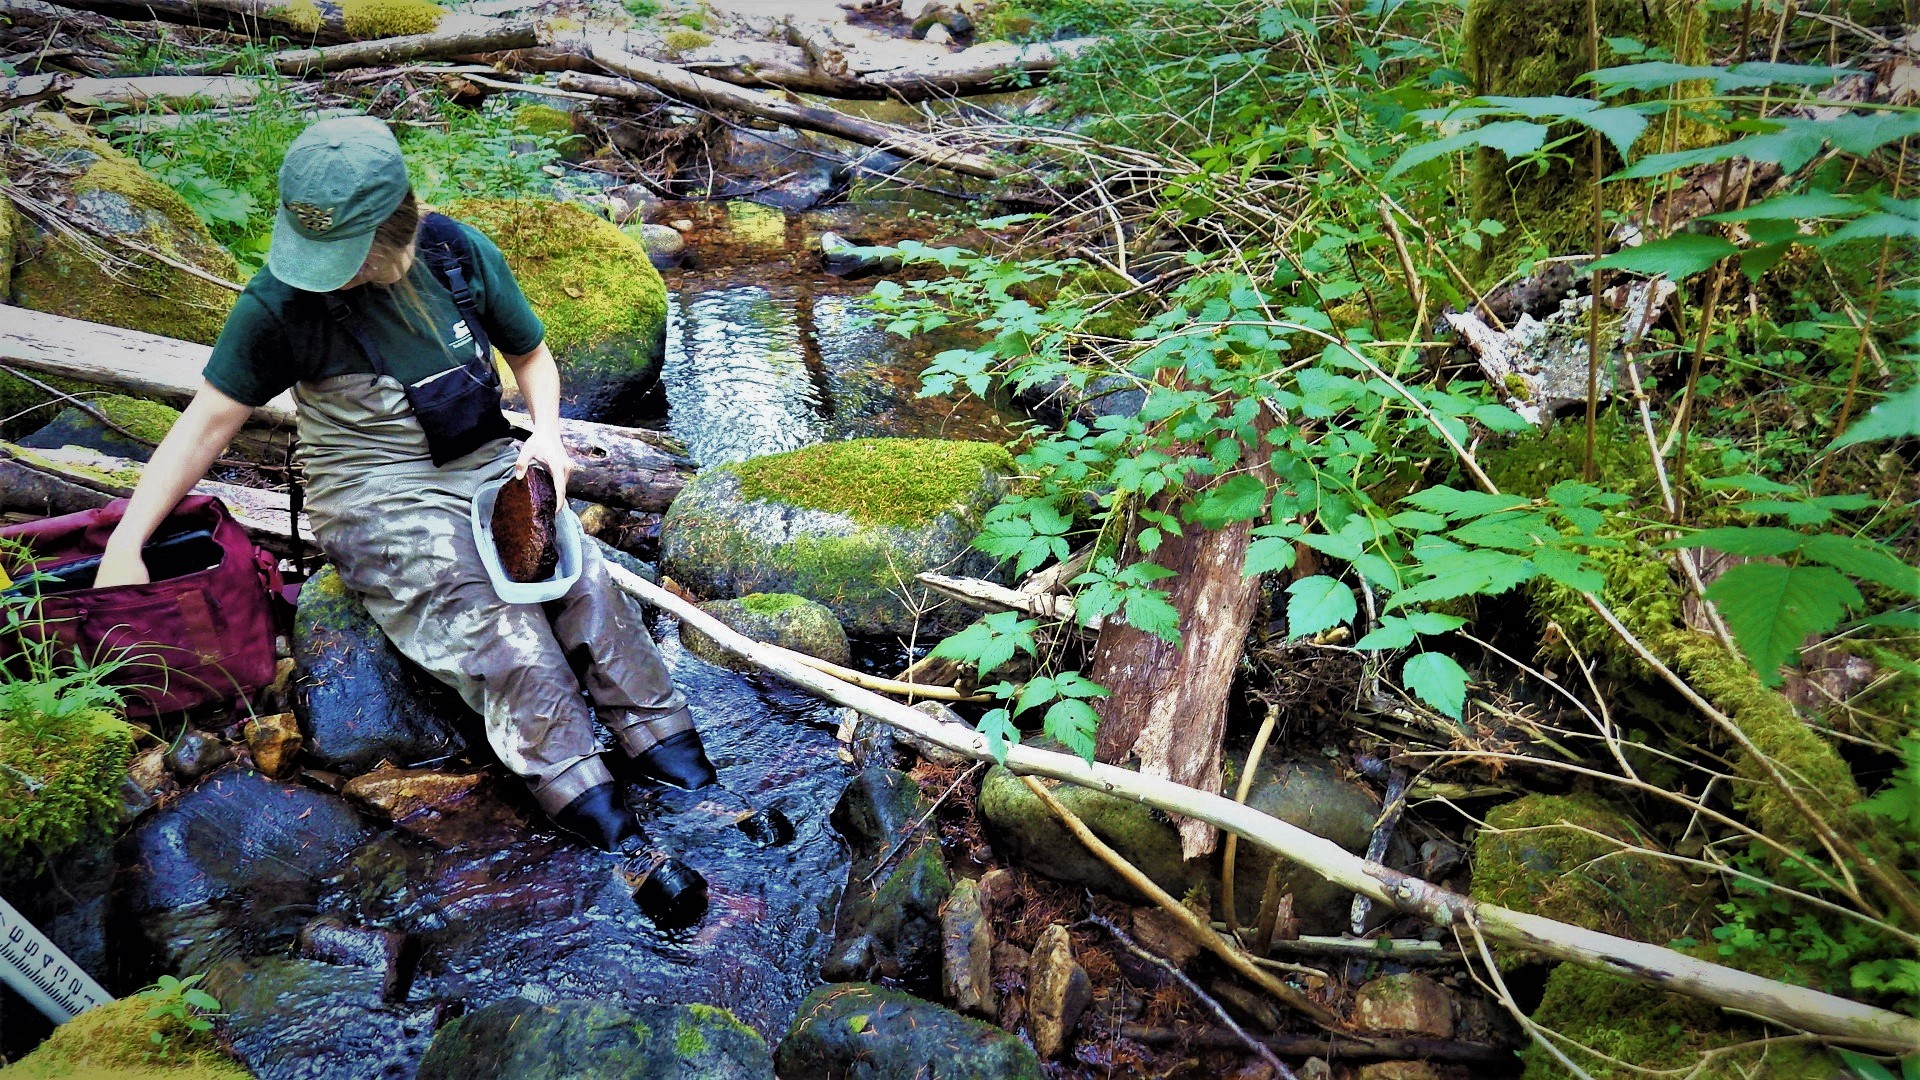
A crewmember collects periphyton, a combination of algae and cyanobacteria, from rock surfaces at the Lower West Fork tributary to the White River.
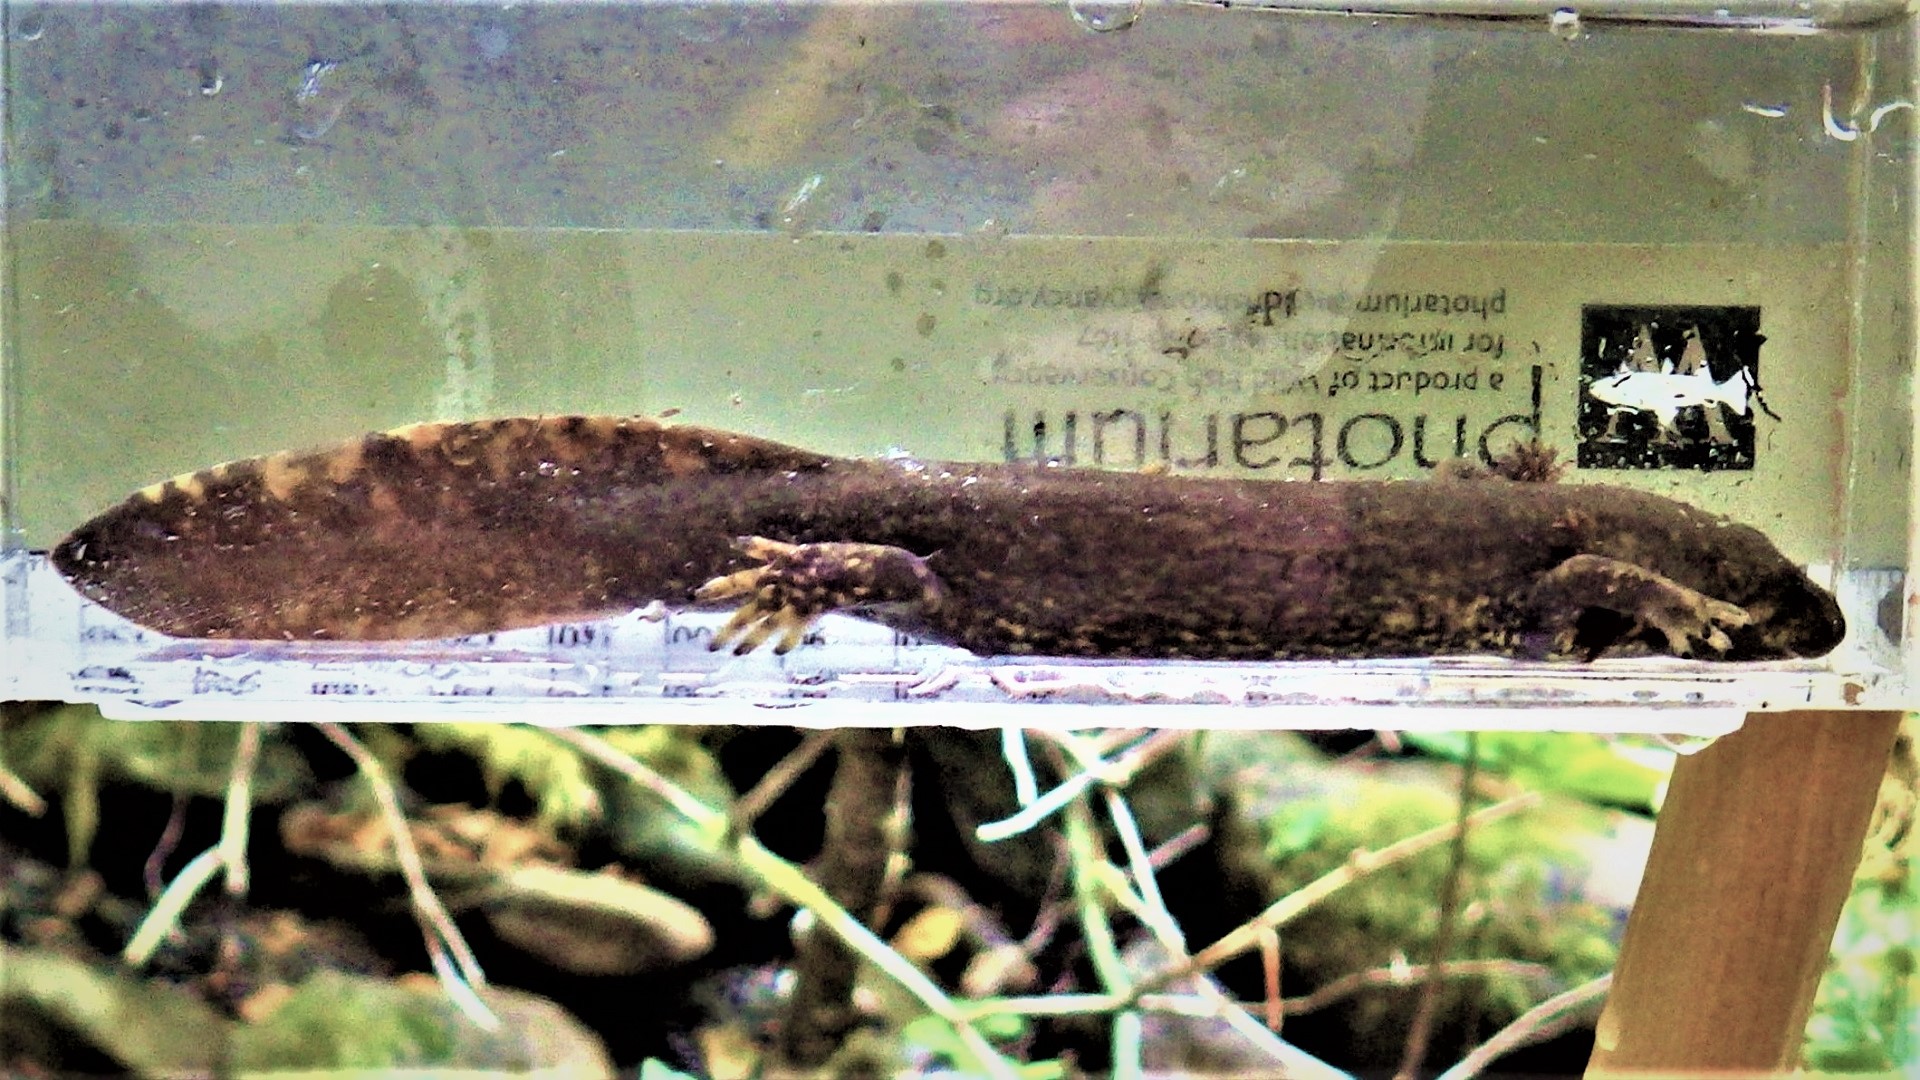
A Cope’s giant salamander at Crane Creek indicates a good, healthy stream.
Crews measure sand/gravel bars and count large woody debris.