

Watershed health — Unlisted Washington update
We investigated the health of stream in the Unlisted Washington Status and Trends Region in 2010 and 2019. In these study years, we saw the region's streams mostly in poor biological condition, with the highest physical indicators involving stream substrate.
Use the map to navigate our reports by Status and Trends Region.
Regional summary
- Benthic Index of Biotic Integrity scores for the Unlisted Region show a majority of streams to be in poor biological condition.
- The most prevalent indicators for streams in the Unlisted Region were increased sand and fine sediments, increased nutrient concentrations, and increased substrate embeddedness.
Biological condition
Invertebrate biological condition of streams did not change meaningfully from 2010 to 2019 in the Unlisted Region. We did see a shift from fair to poor condition in 2019, as compared to 2010, but this is a small change. Most notably from these findings, it shows that both years of sampling have a majority of stream kilometers classified as being in poor biological condition.
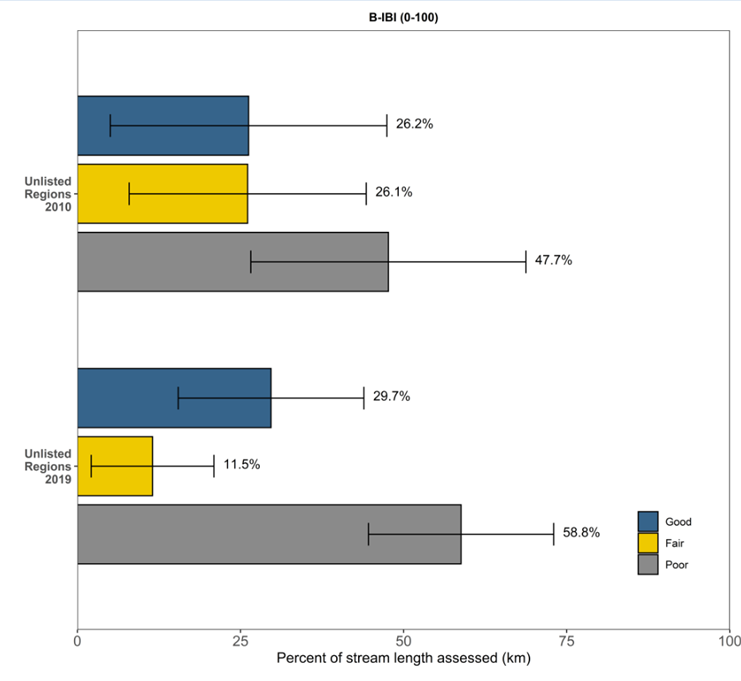
We used B-IBI ratings from 2010 and 2019 to obtain the percentage of stream kilometers in good, fair, and poor conditions for the Unlisted Region. Error bars represent 95% confidence intervals.
Significant physical and chemical indicators
In 2010 and 2019, four indicators were categorized as poor for over 50 percent of the stream extent assessed. In 2019, two of those indicators were over 80 percent, including bed stability and percent sand fines. Nitrogen, phosphorus, and average embeddedness were also poor in a high percentage of stream extent sampled, remaining over 50 percent for both 2010 and 2019.
To interact with this graph and learn more about these physiochemical indicators, hold your mouse over each bar.
This interactive graph shows the percentage of stream kilometers assessed with poor physiochemical conditions in the Unlisted Region for 2010 and 2019. The x-axis represents the percentage of river extent in poor condition. Error bars show 95% confidence intervals.
Flip through our field photos!
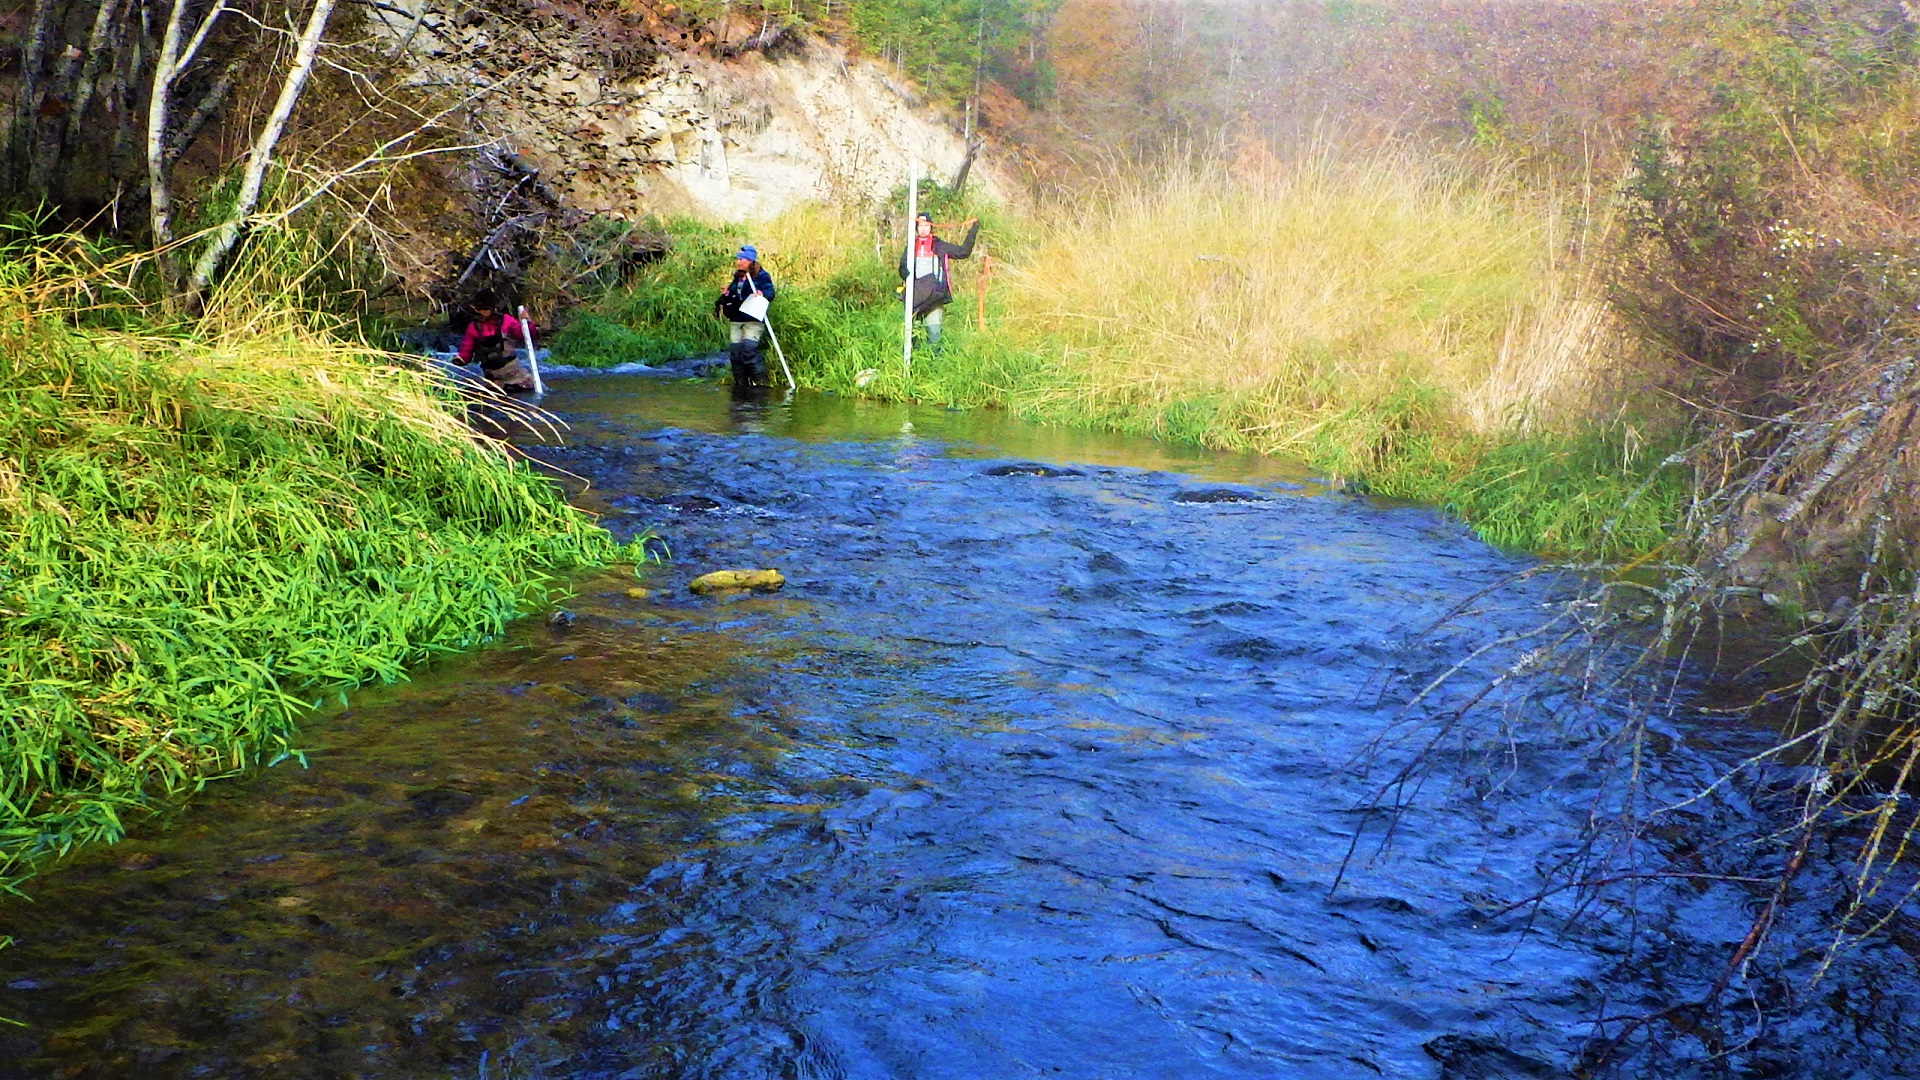
Crews measure bankful heights to understand high flows at Dragoon Creek.
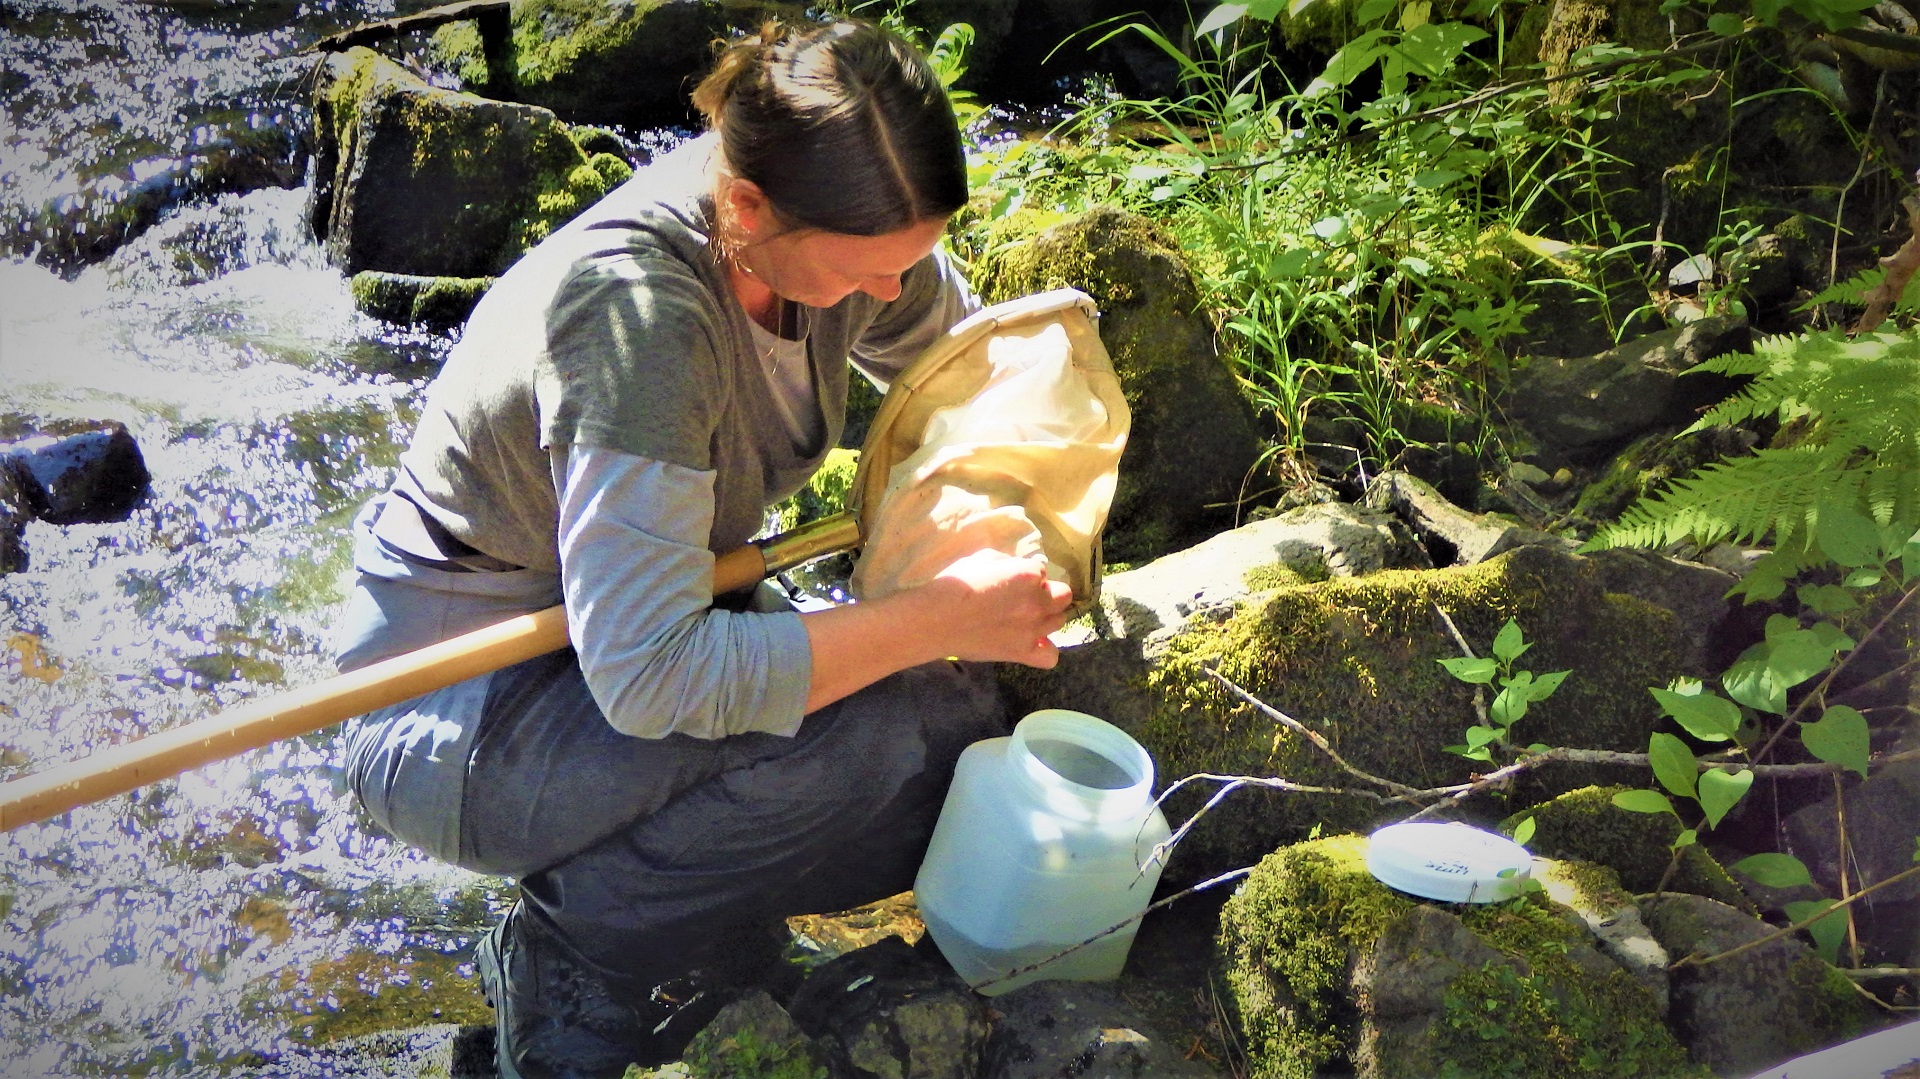
Collecting macroinvertebrates gives us a snapshot of stream health at the Little Pend Oreille River.
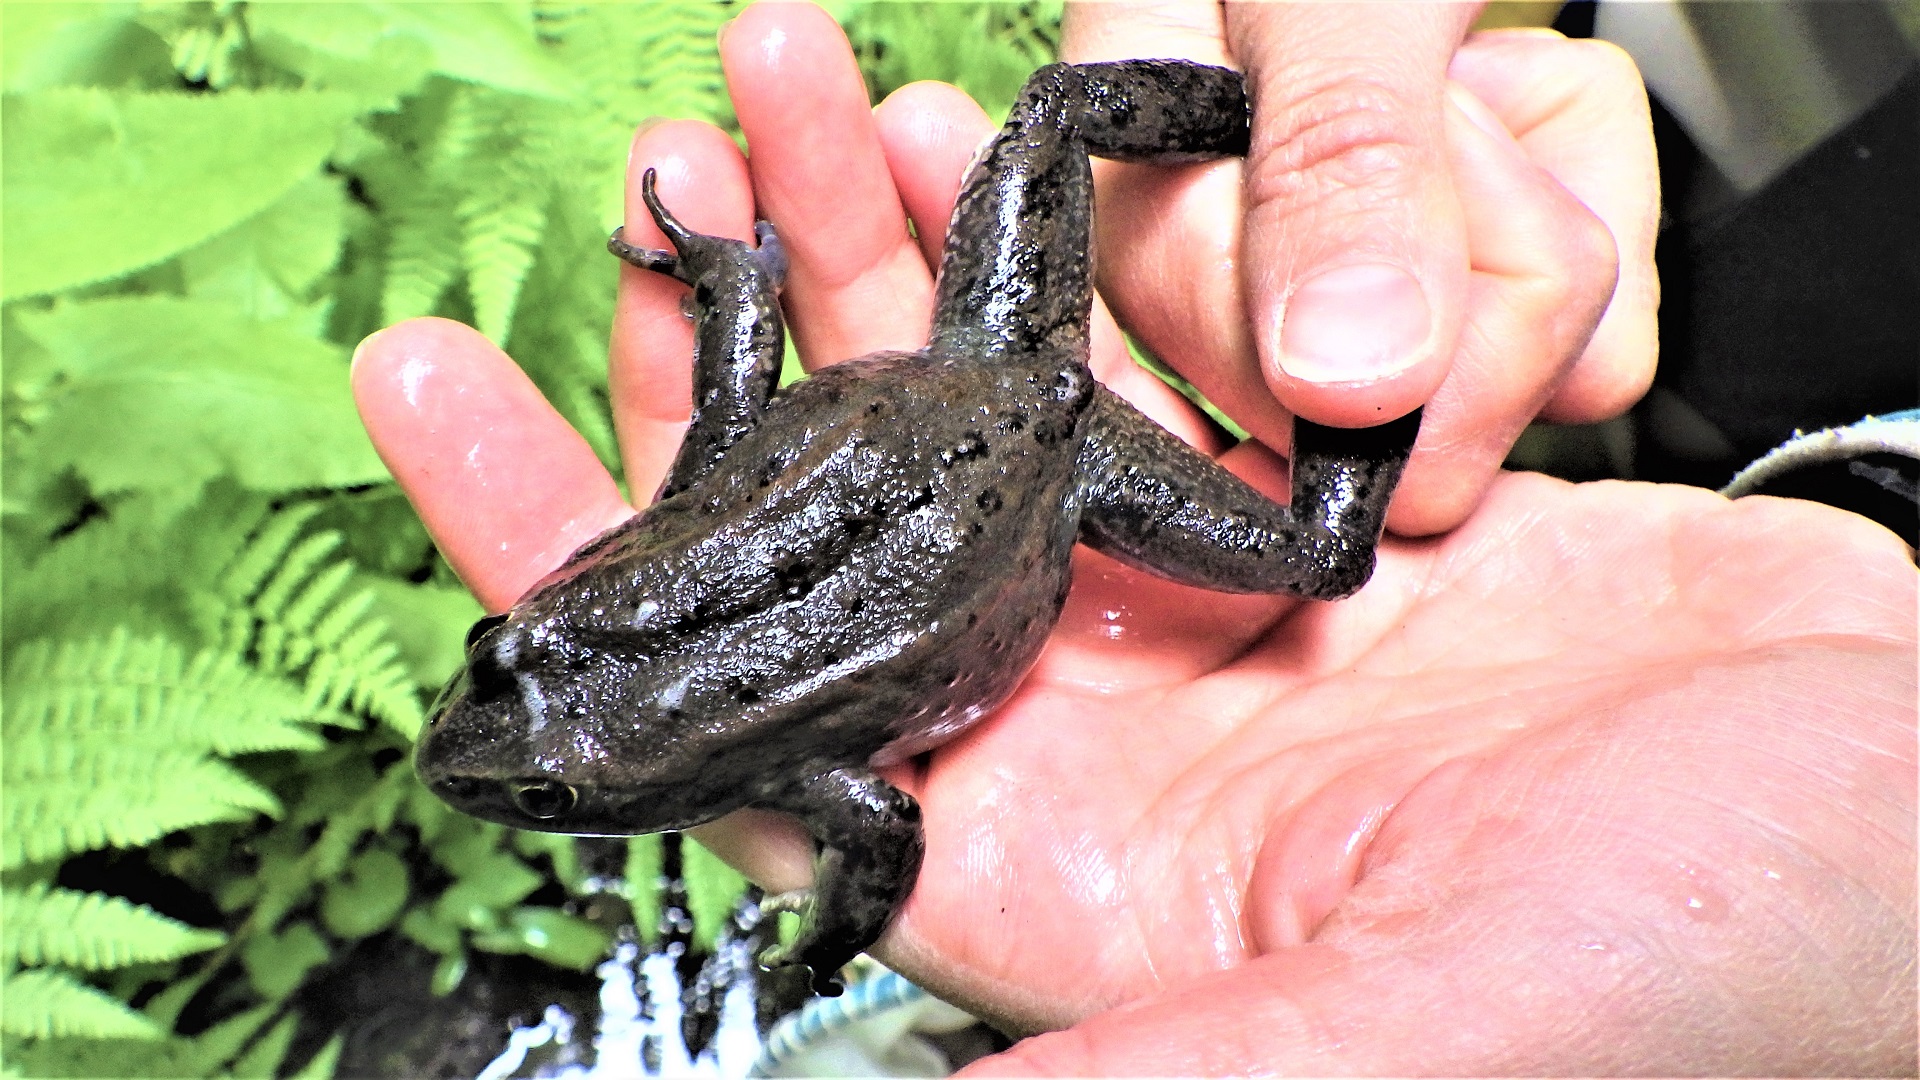
The Columbia spotted frog thrives in cool slow-moving water at Flodelle Creek.
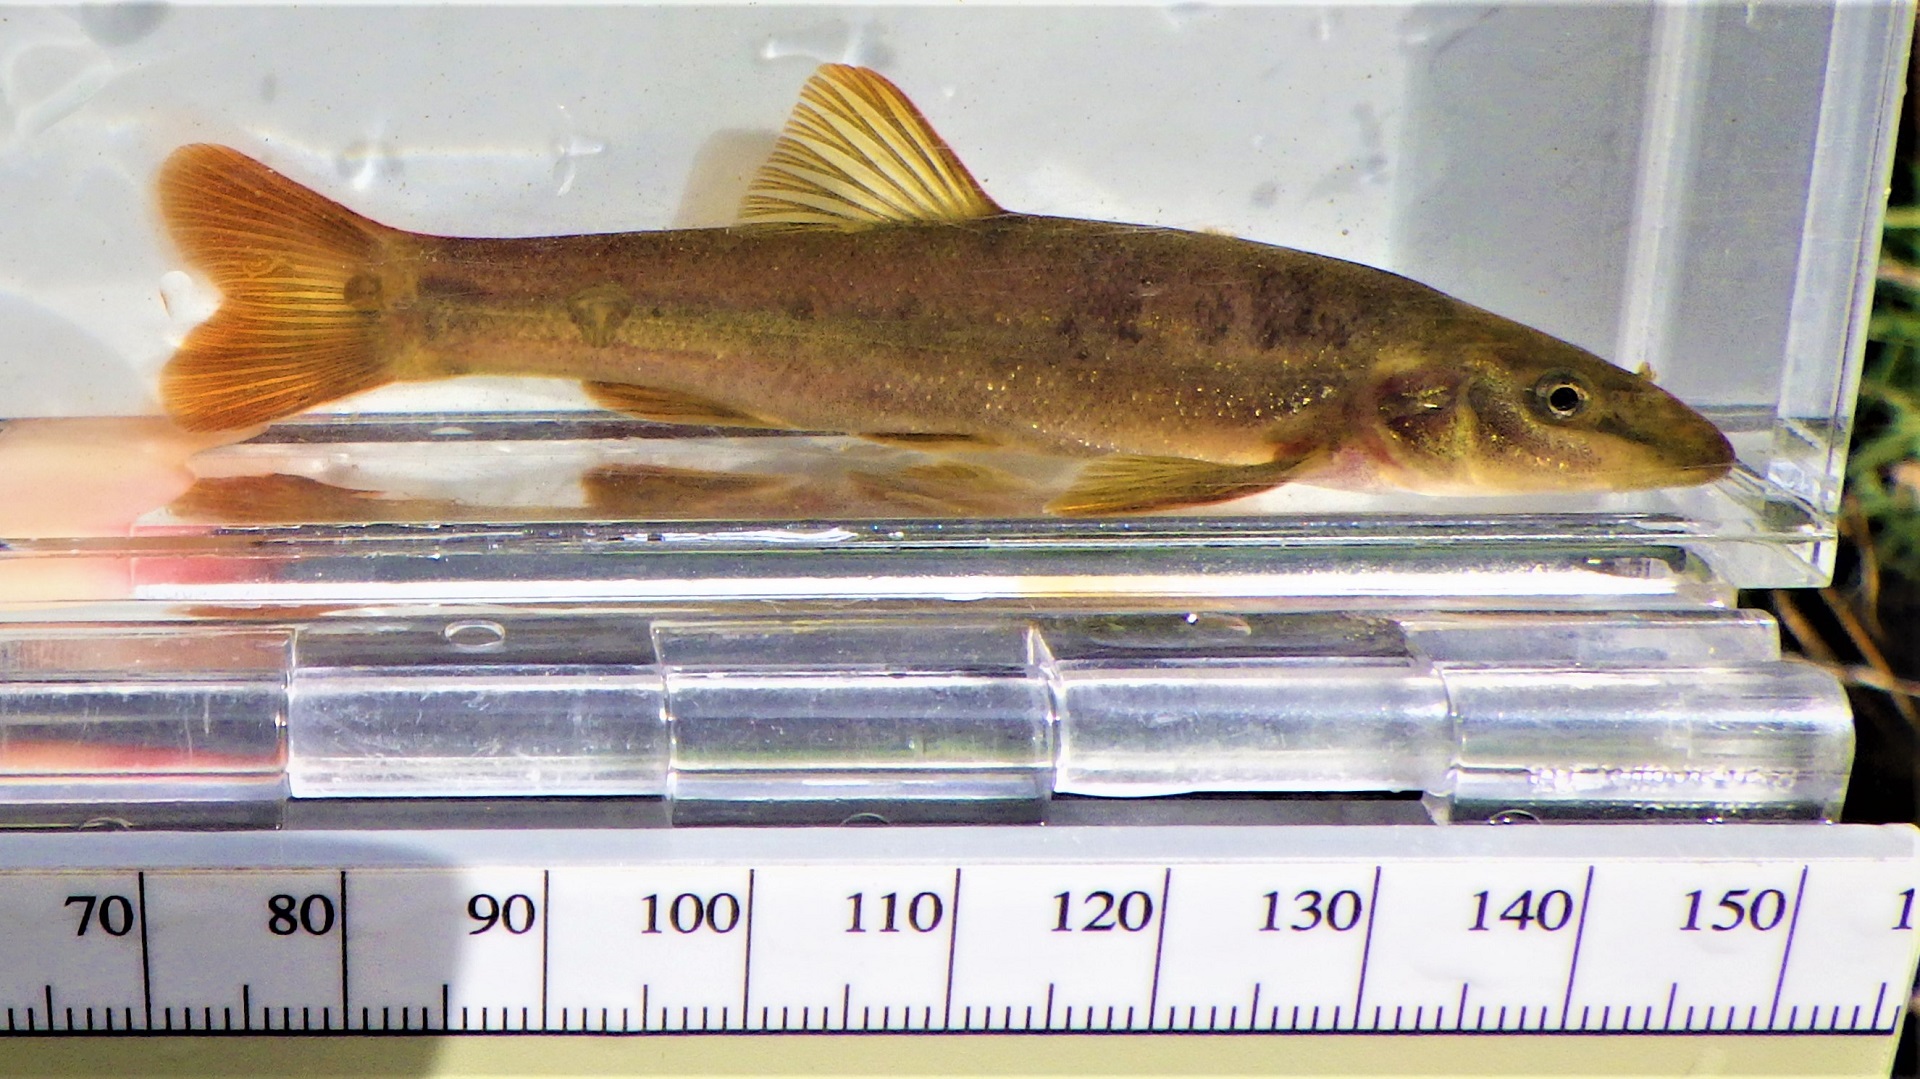
Longnose dace are indicators of good water quality at Hangman Creek.
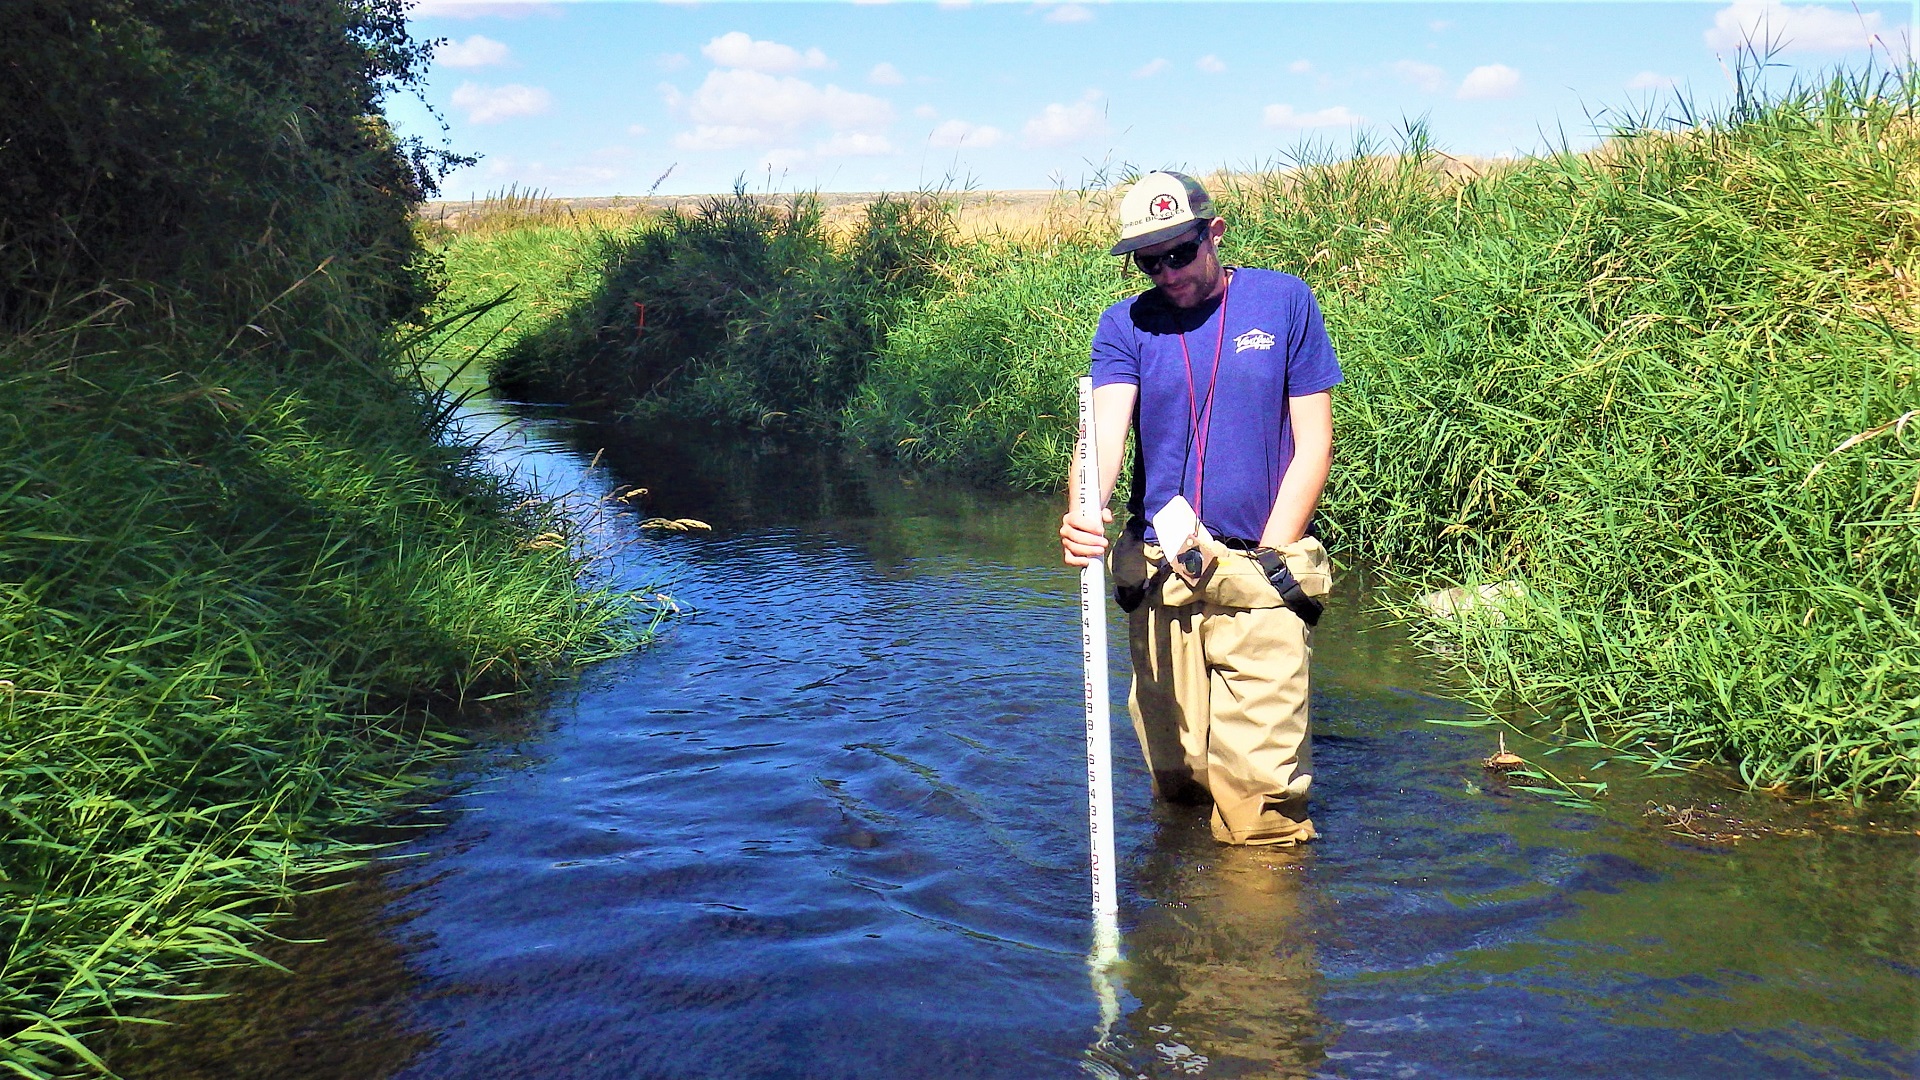
Measuring wetted depths at Crab Creek allows us to gain a stream profile and roll up the data for a picture of stream health.
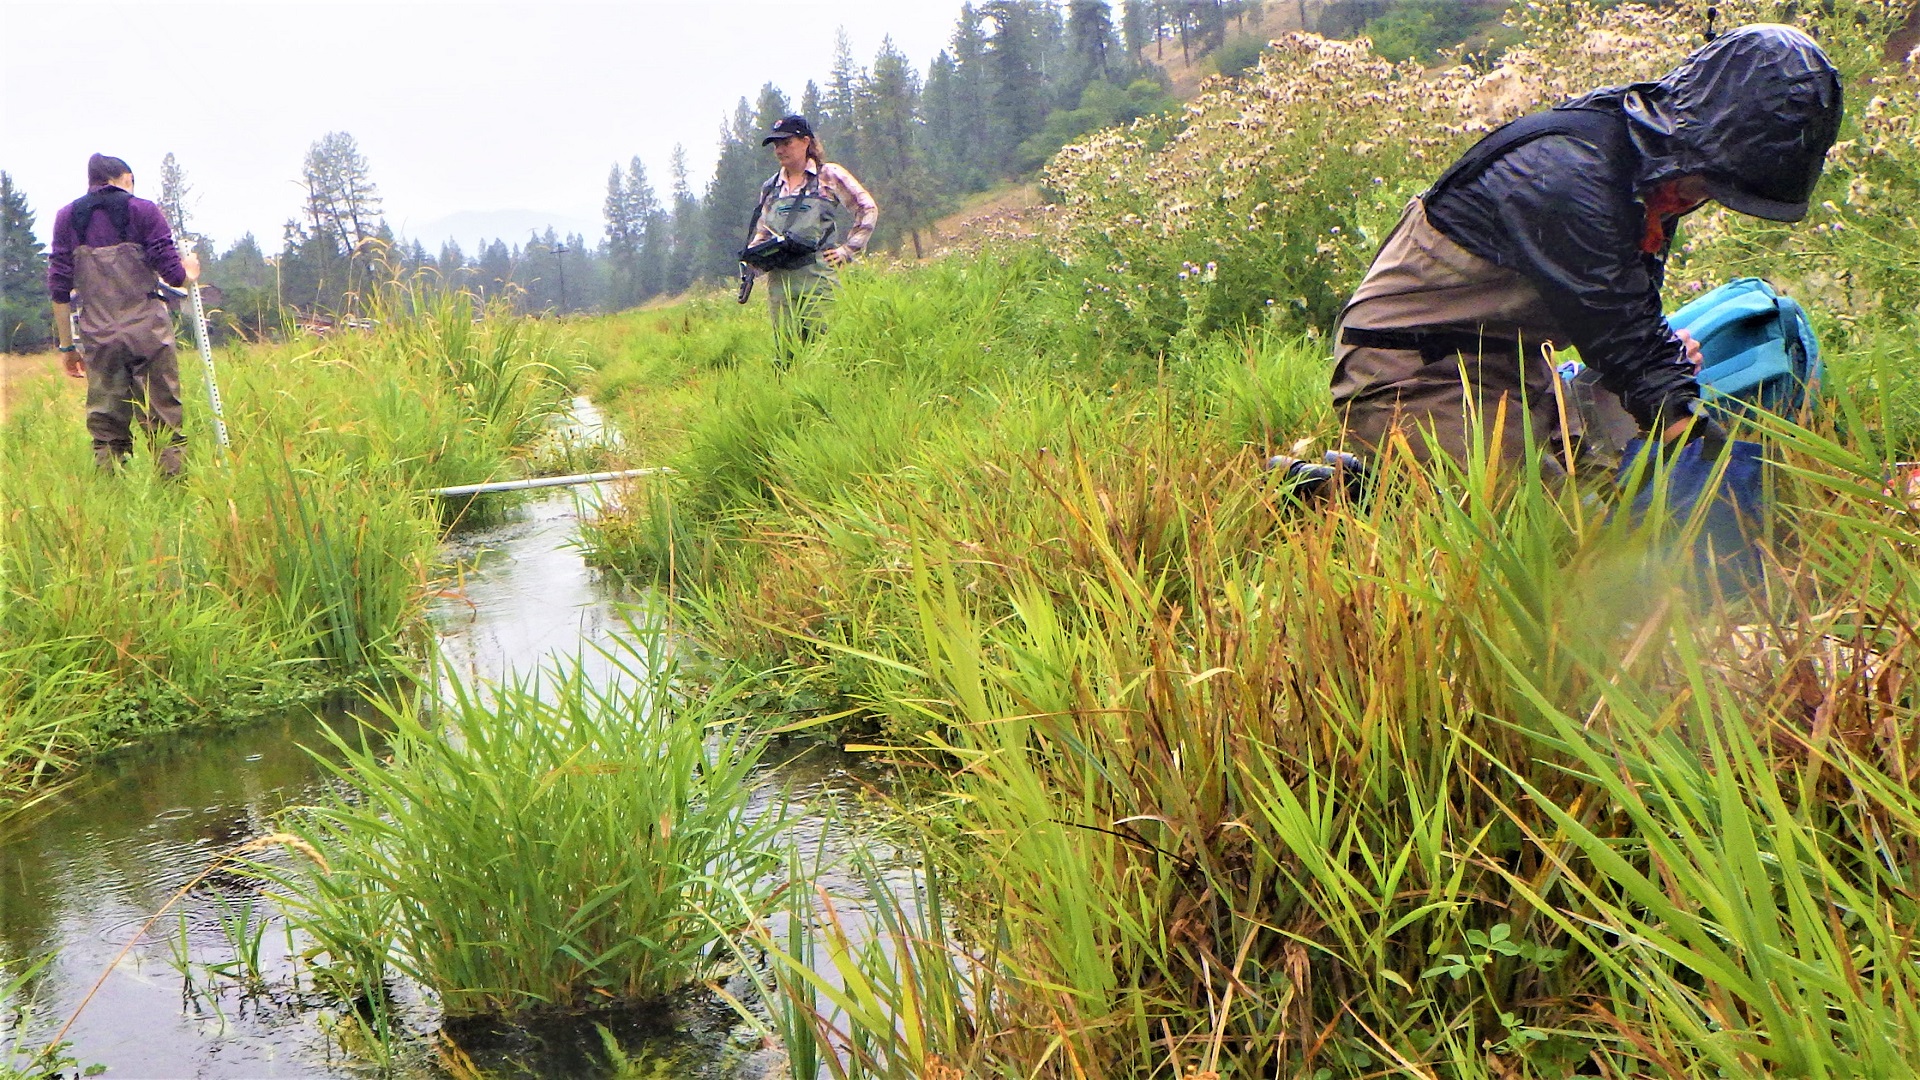
One team at Bulldog Creek measures wetted widths at 10 transects, while another collects vertebrates.
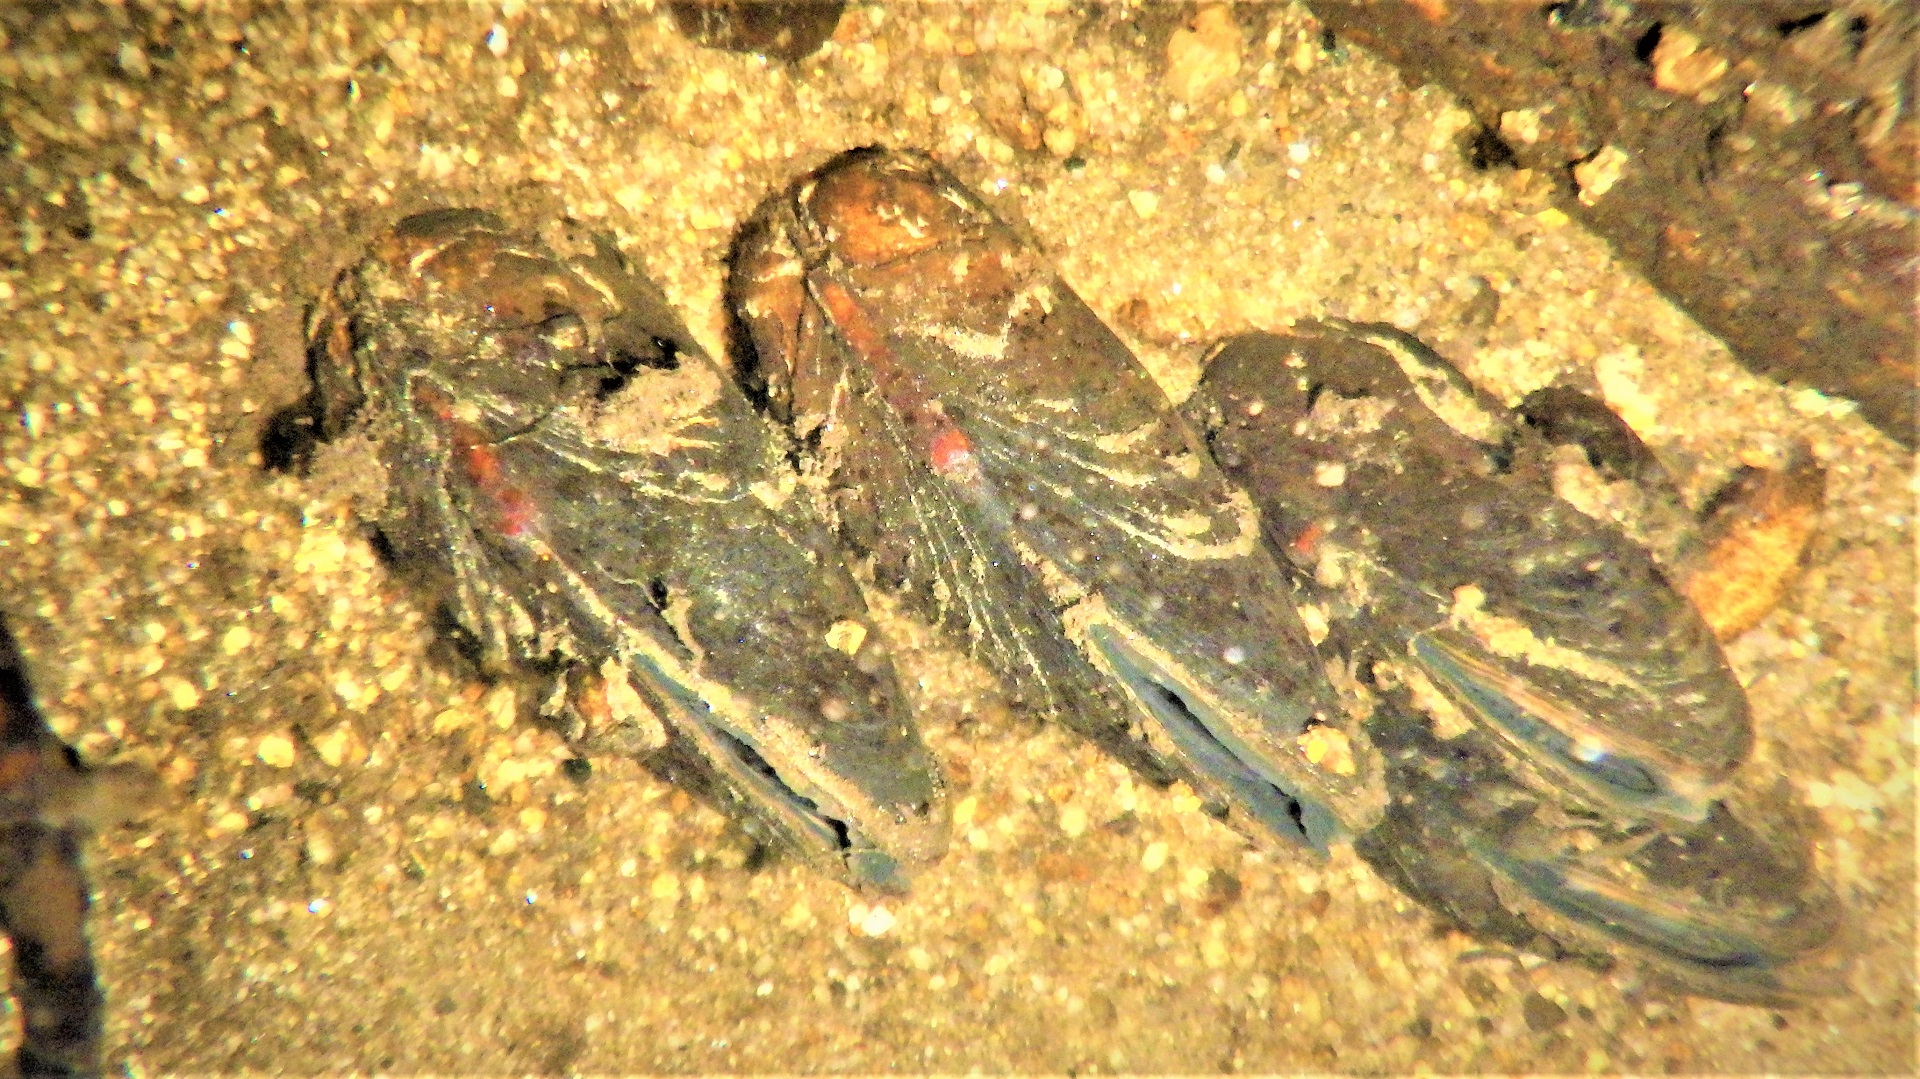
Freshwater mussels like these in the Little Pend Oreille River are excellent indicators of healthy water quality. They are long-lived and sensitive to environmental changes.
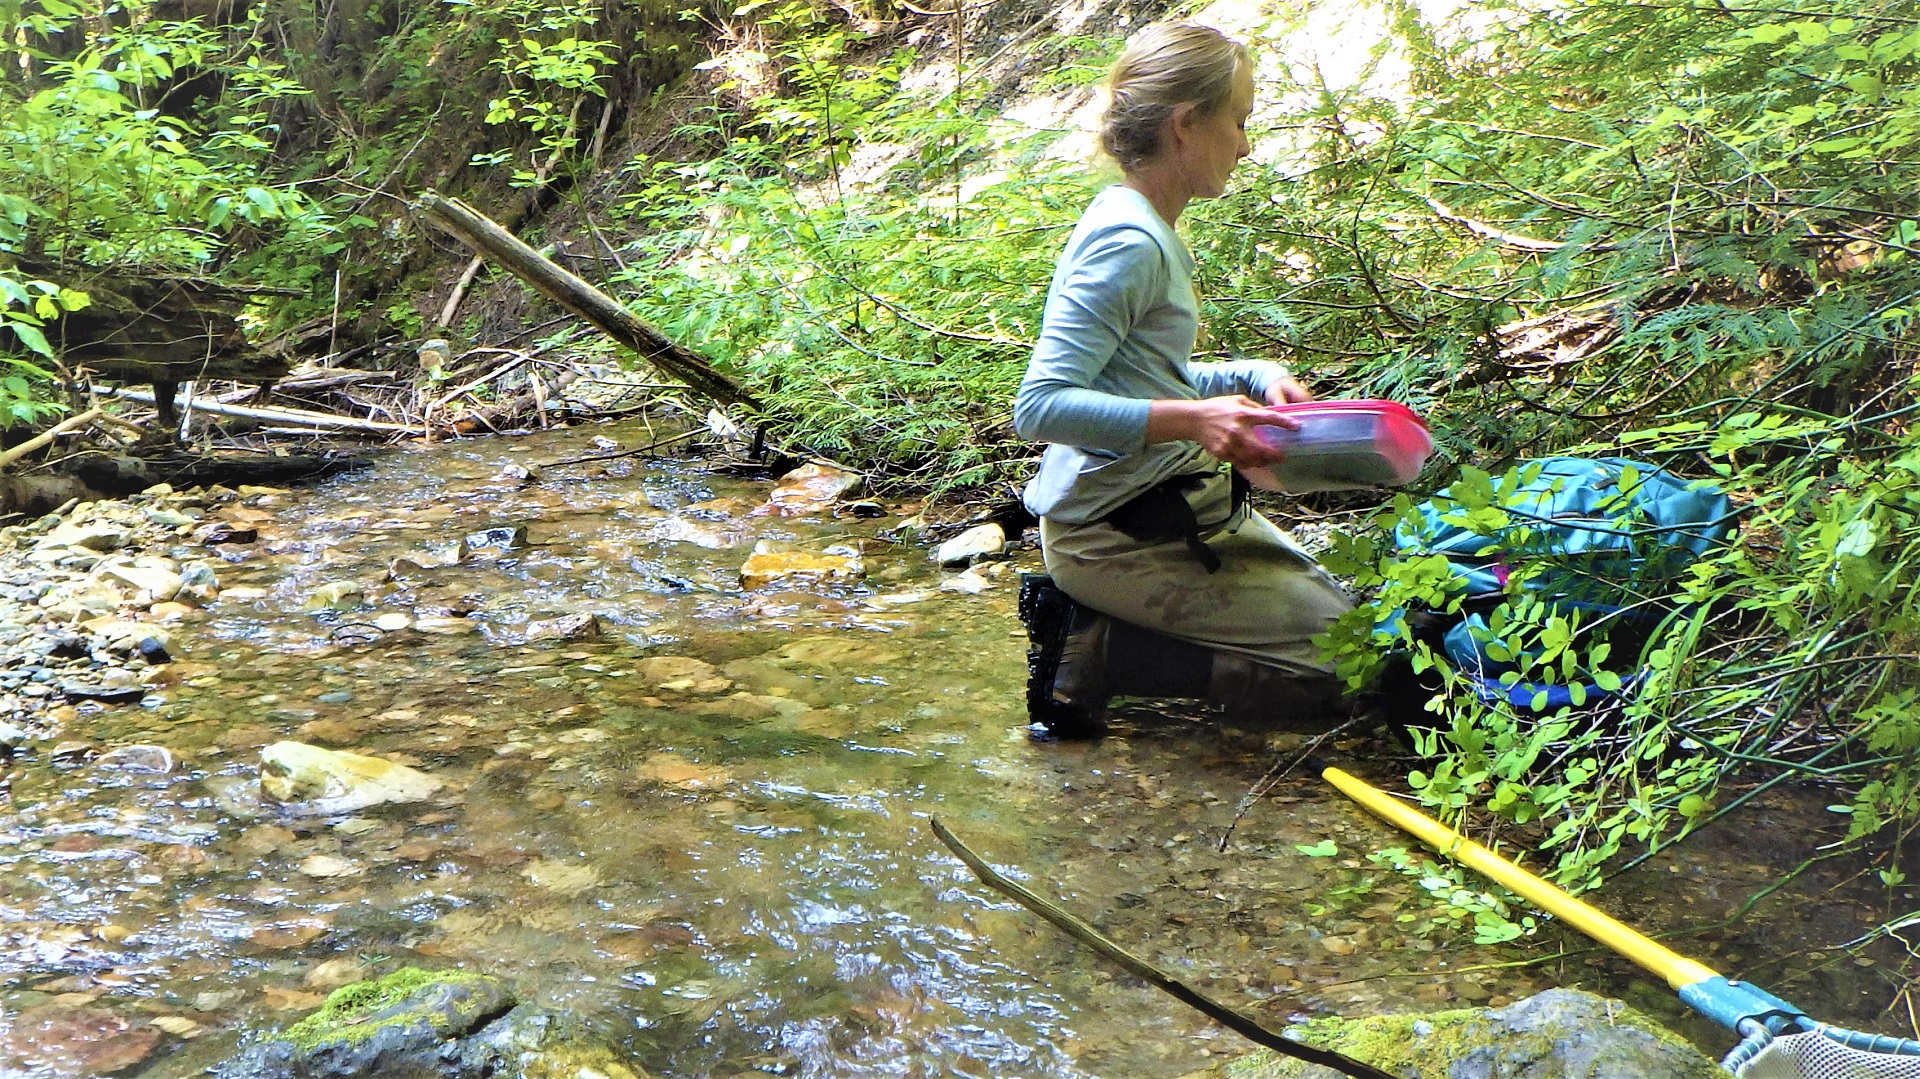
Crews collect periphyton, the green slime on stream rocks, at Marble Creek to understand the health of the stream and to learn more about algae's role.
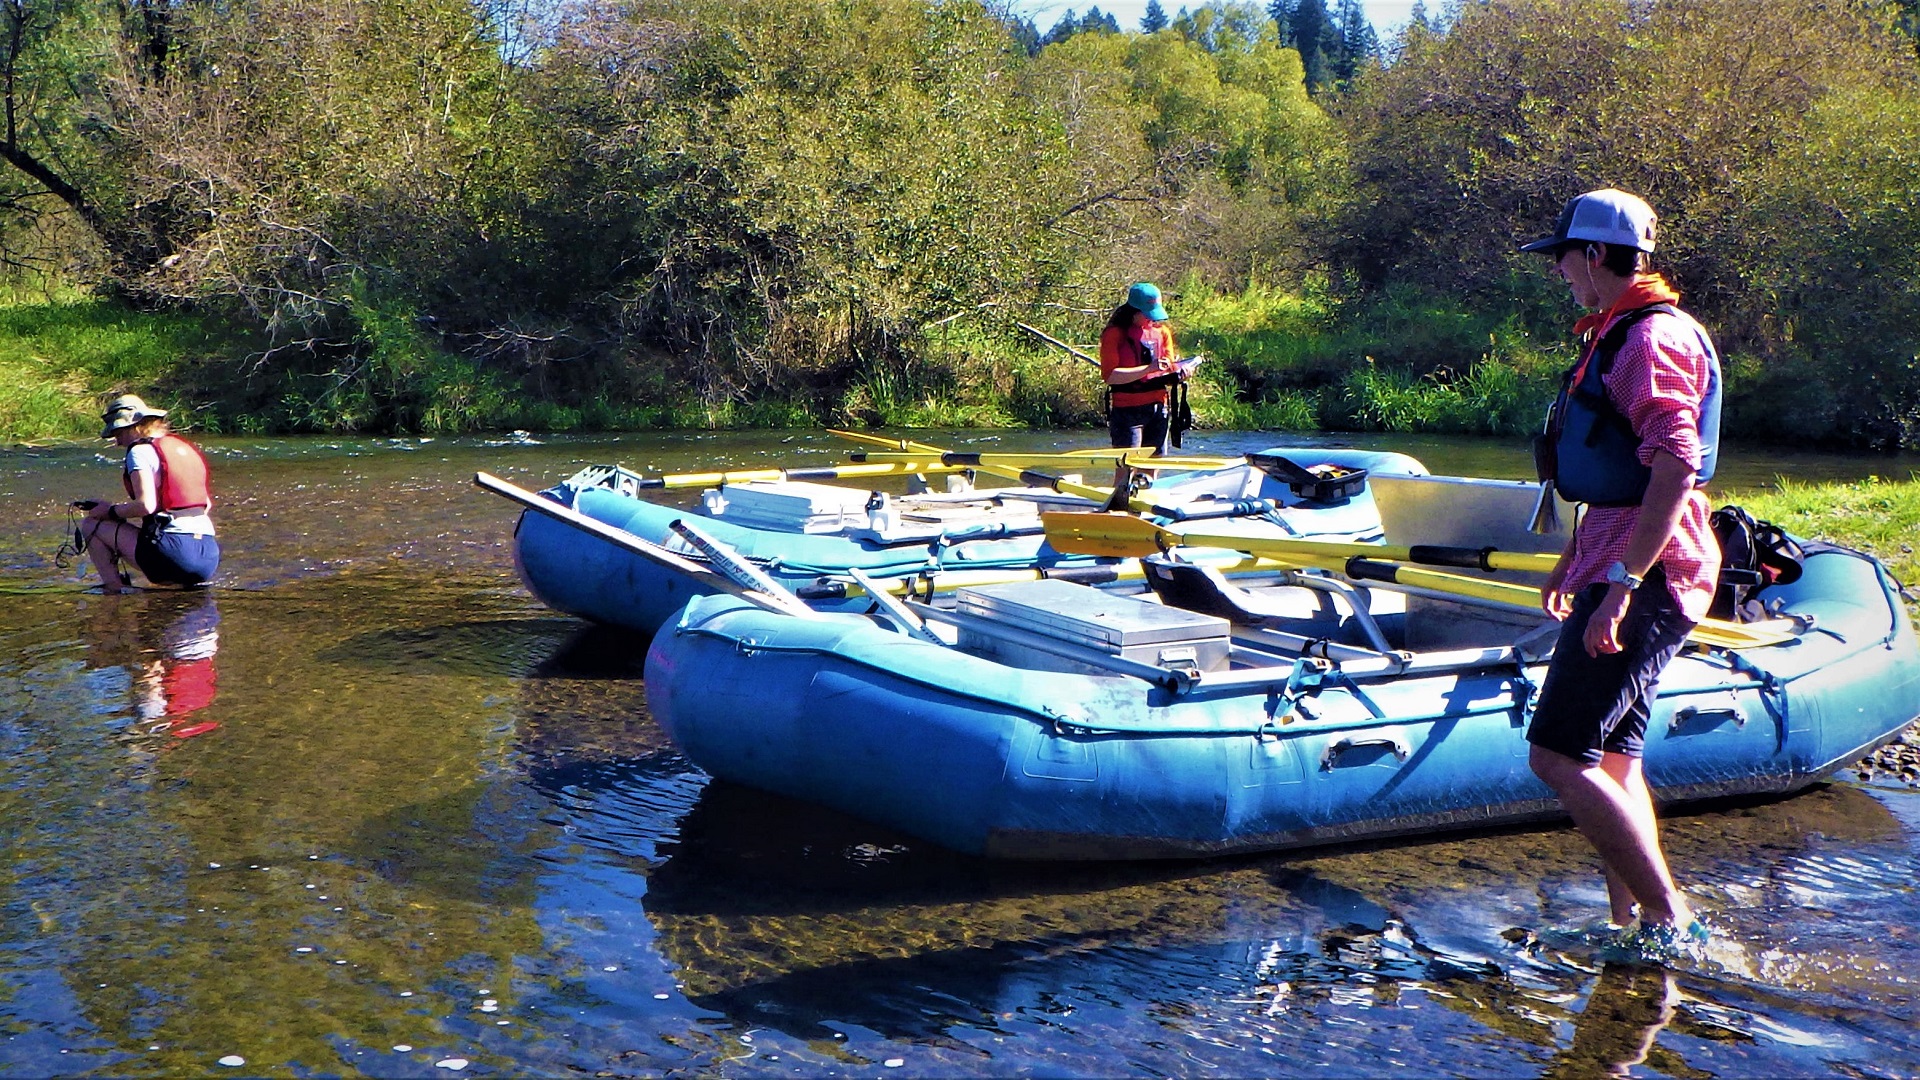
Crews use the "Wide Protocol" and float on large sites, such as at the Little Spokane River.
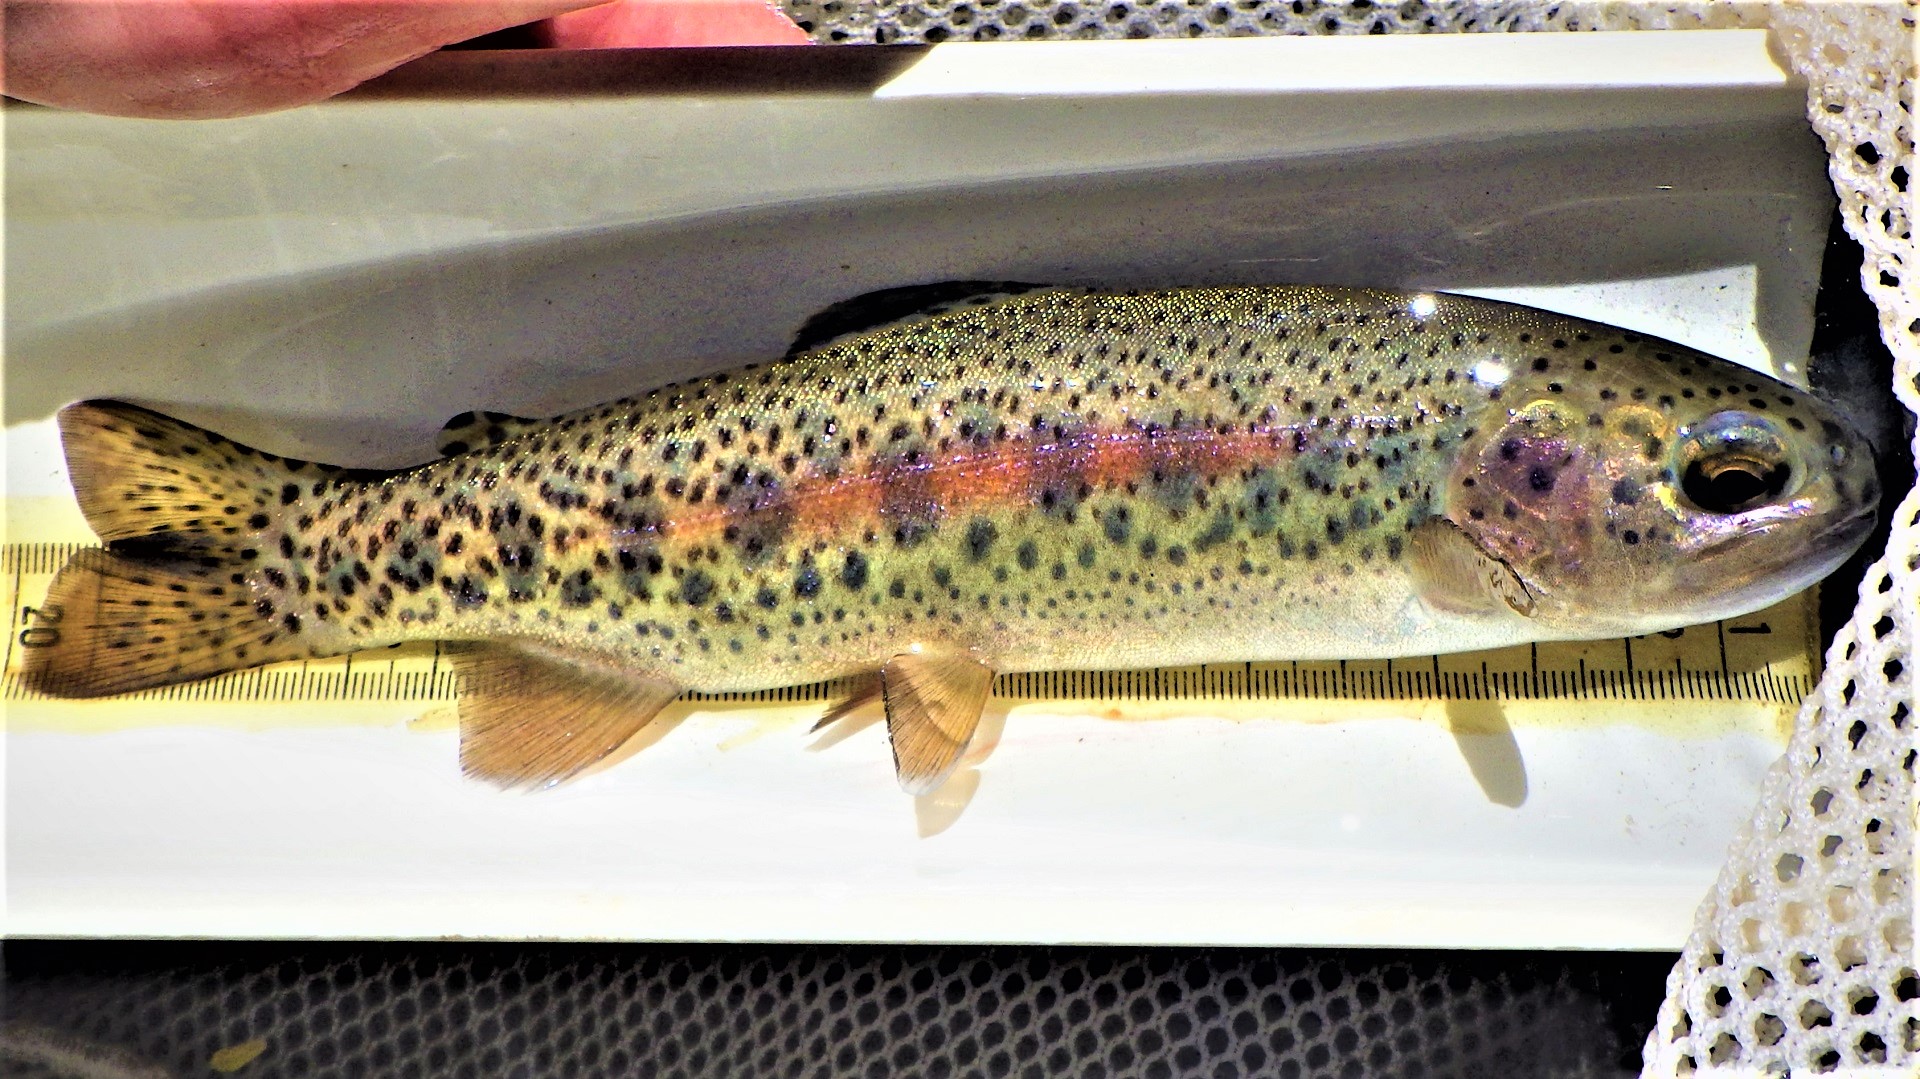
A healthy adult rainbow trout from Colockum Creek indicates cool clean water.
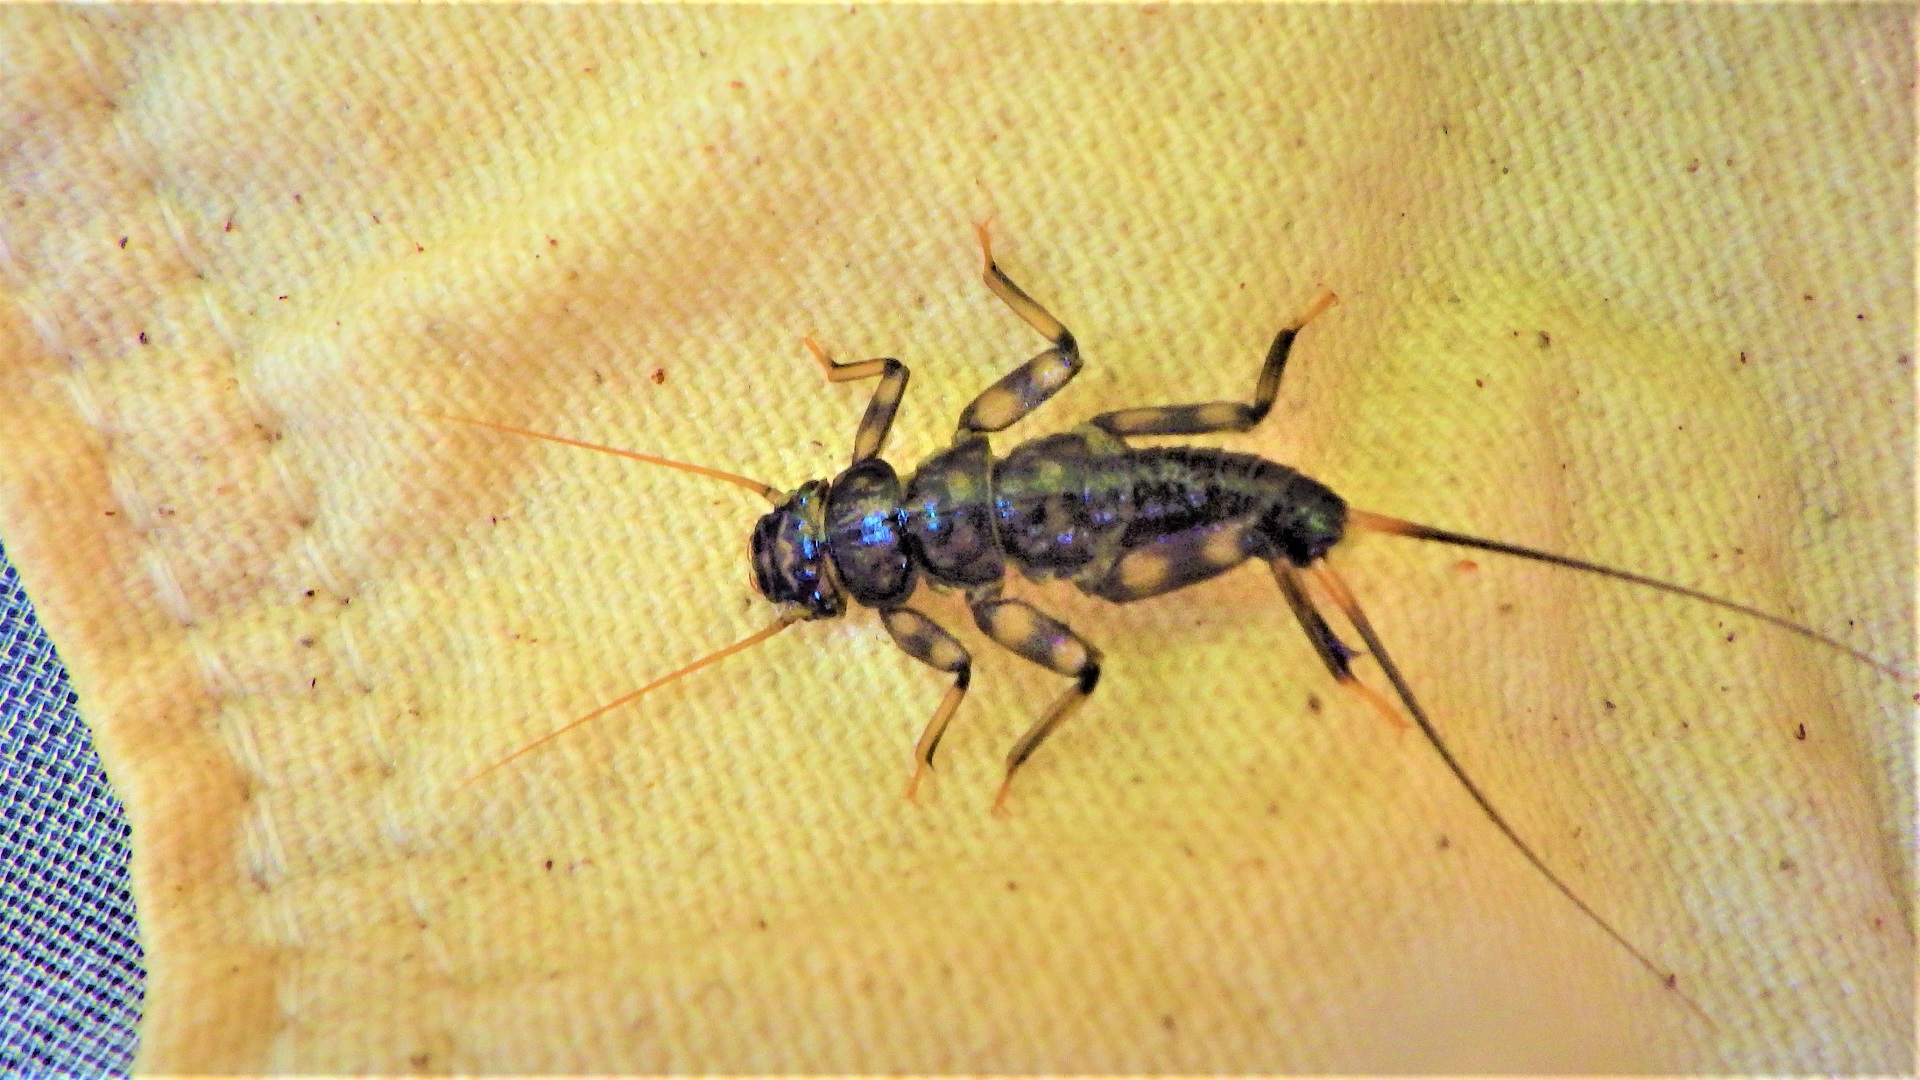
A stonefly is an indicator of health at the Little Pend Oreille River.
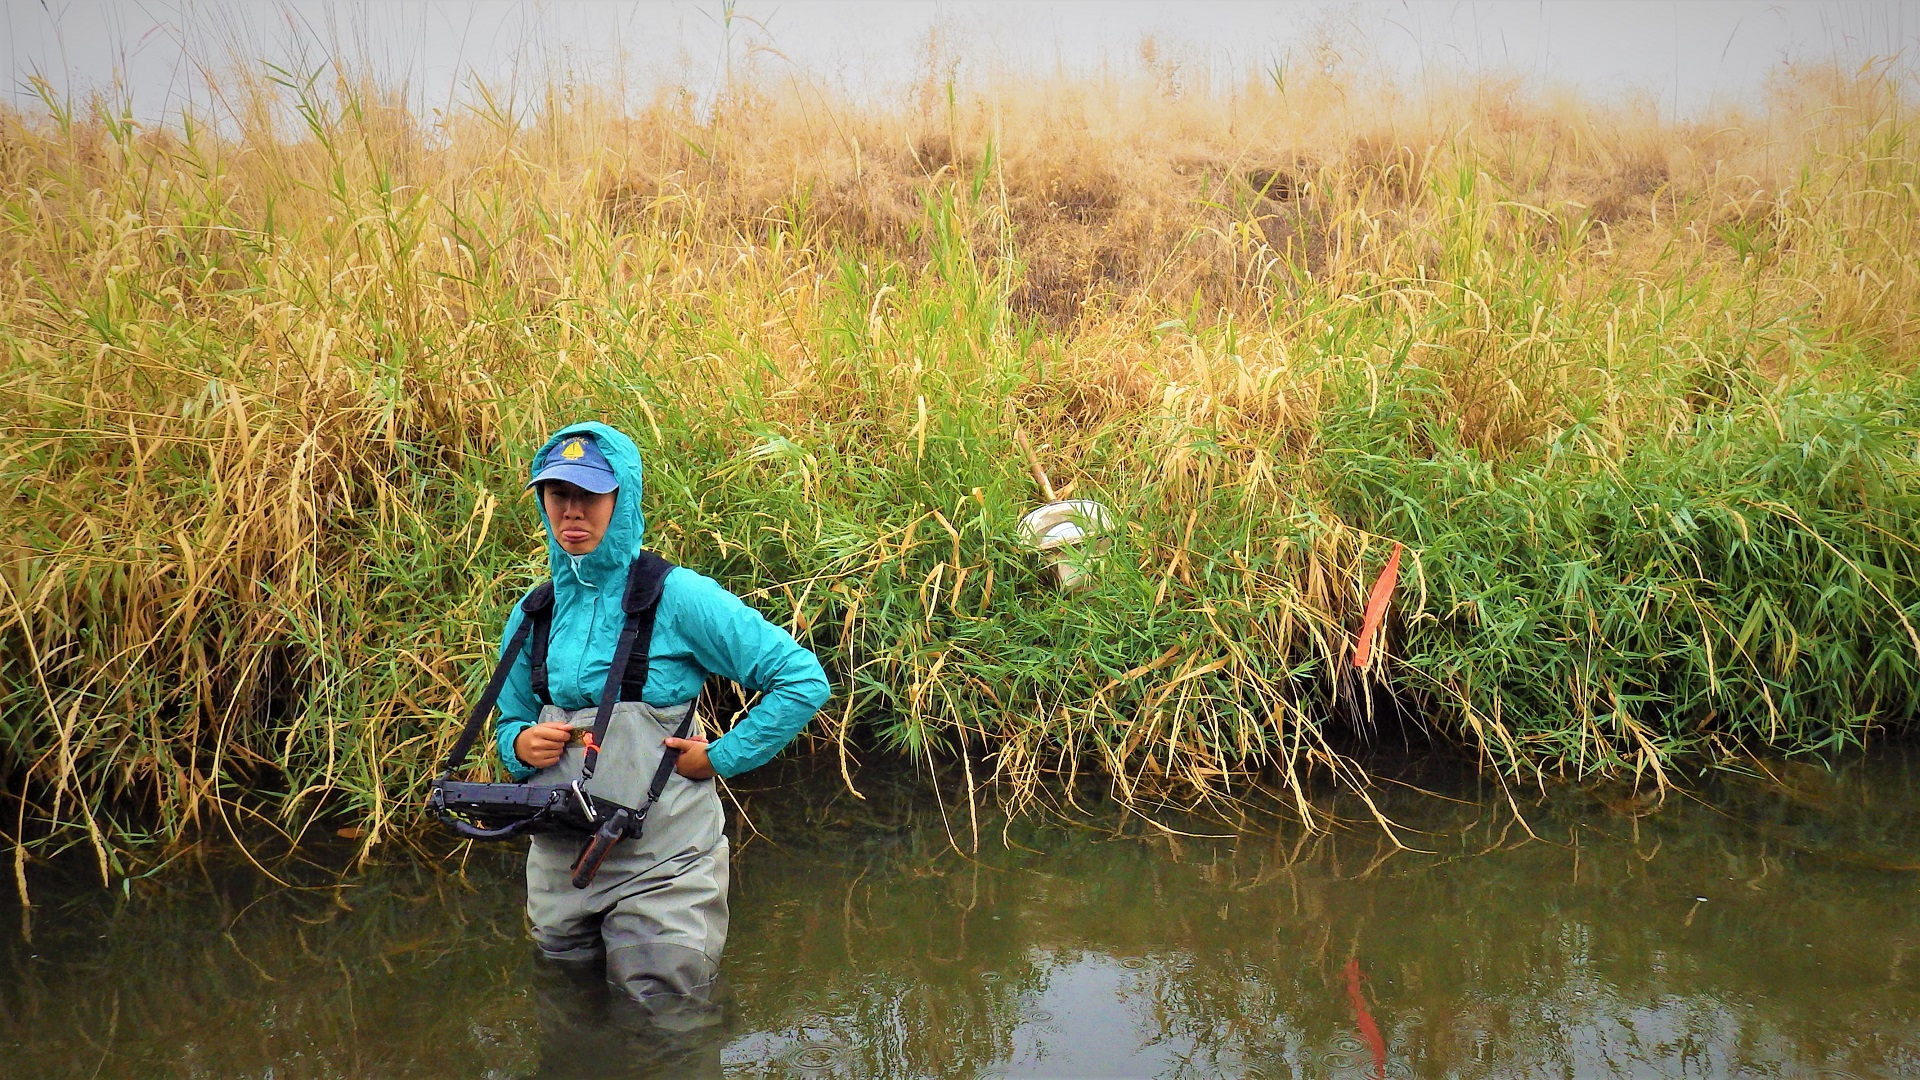
Crews collect data at Rock Creek on a mobile tablet. Later, these data are verified for quality assurance.
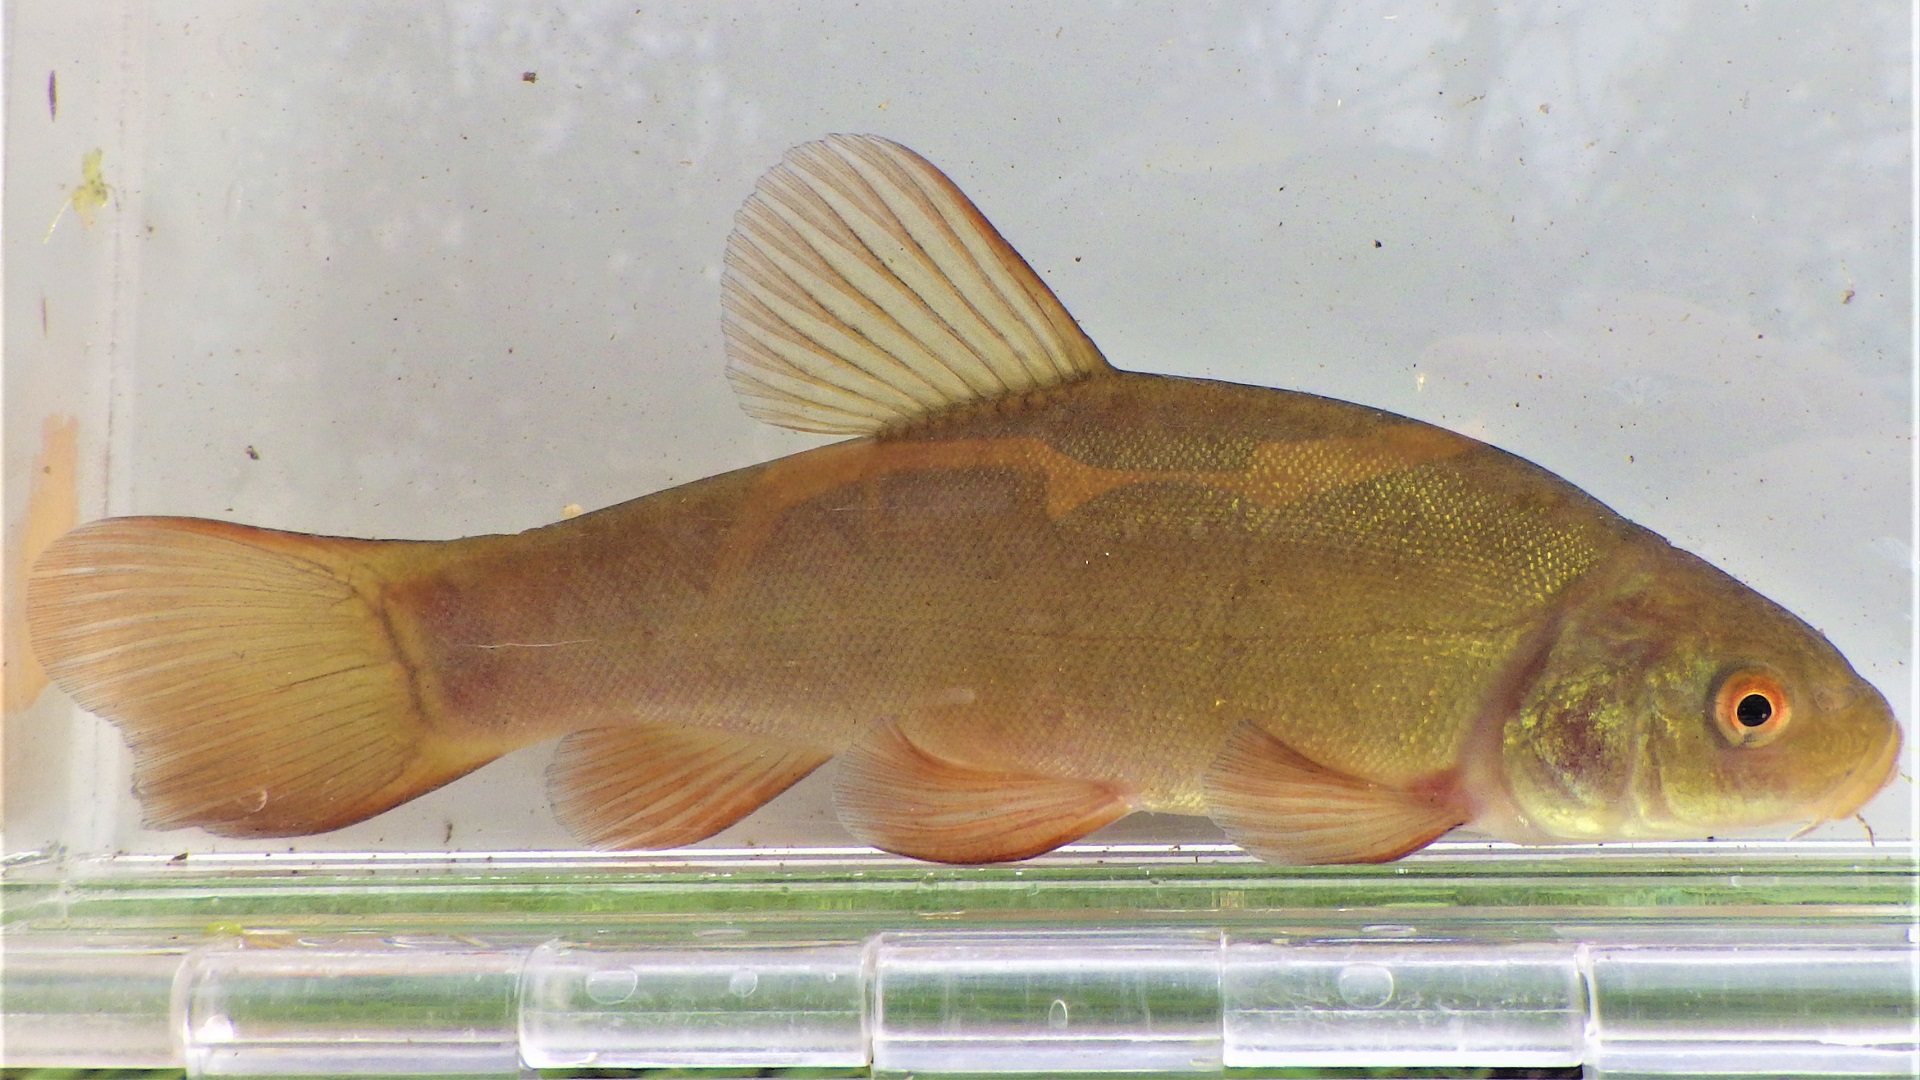
This tench from Marshall Creek is an invasive species that outcompetes native fish for food resources. They prefer warm and shallow slow-moving water.
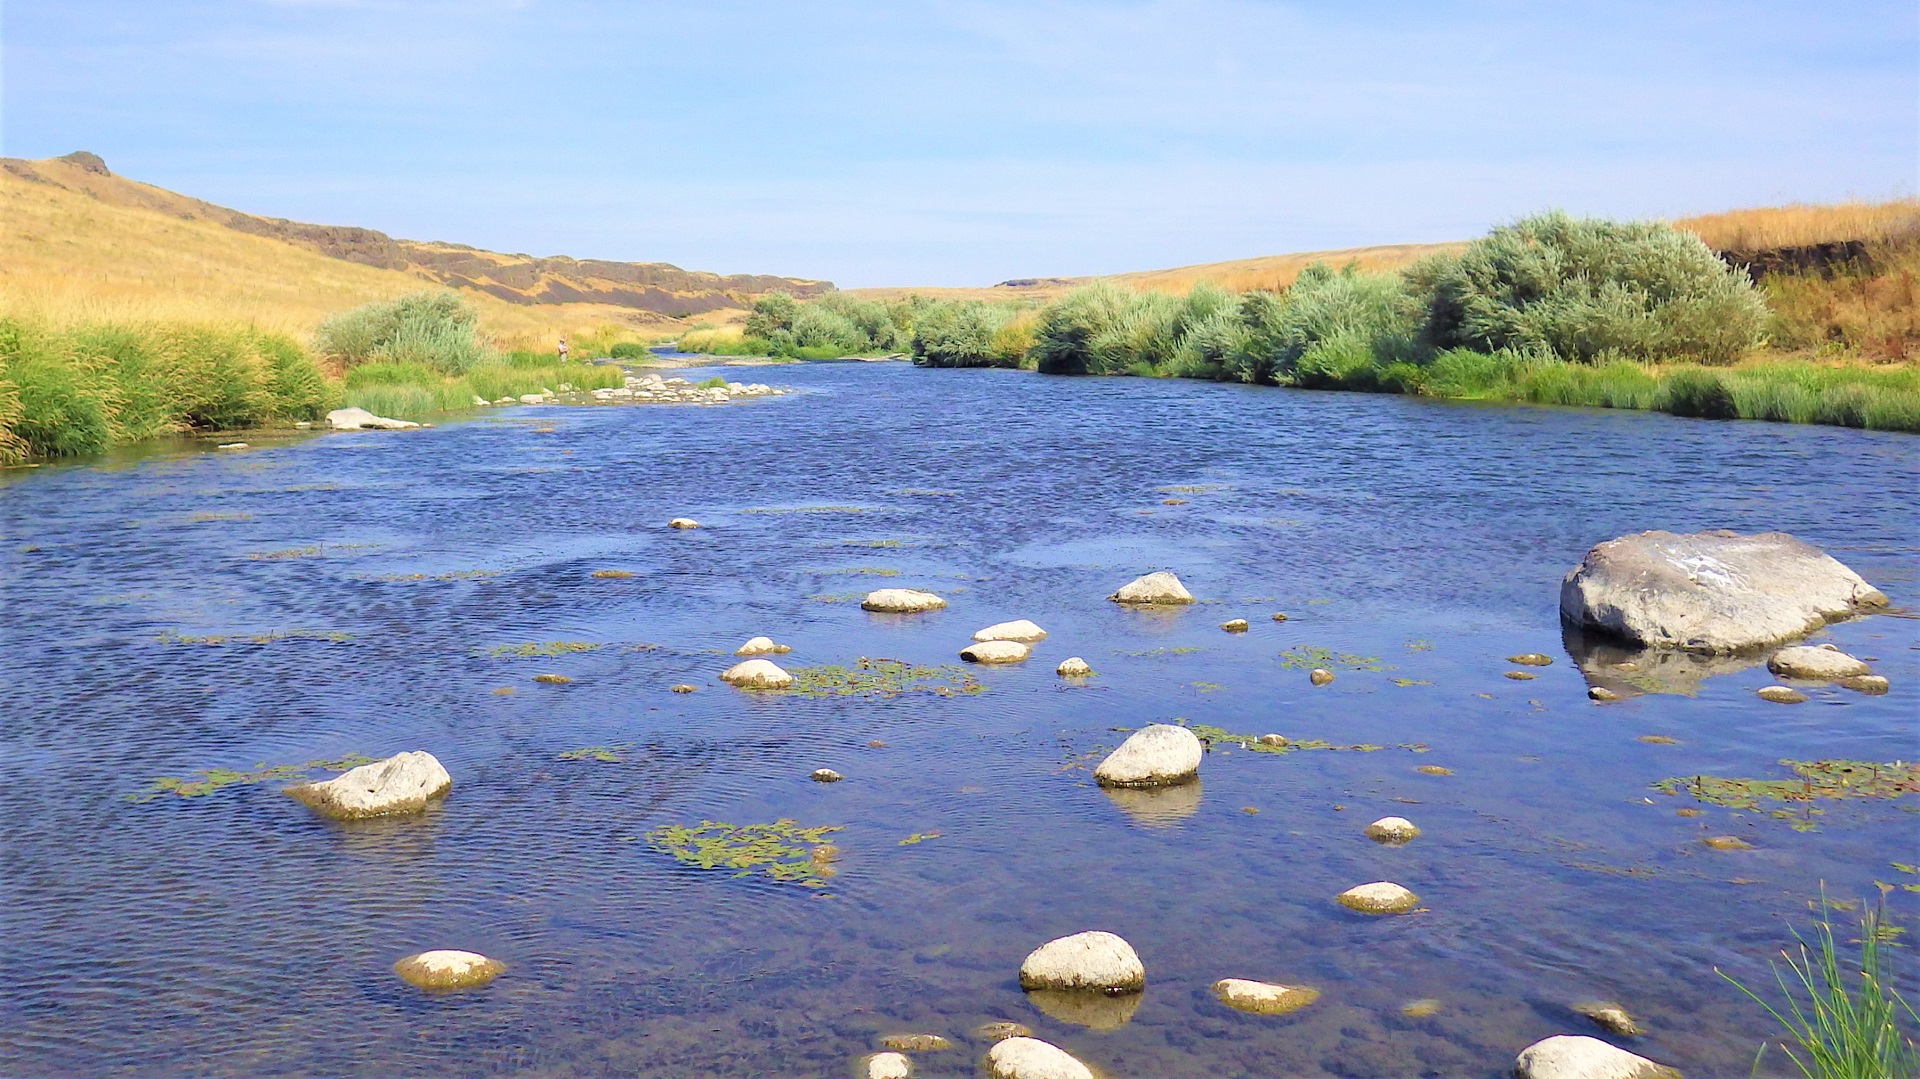
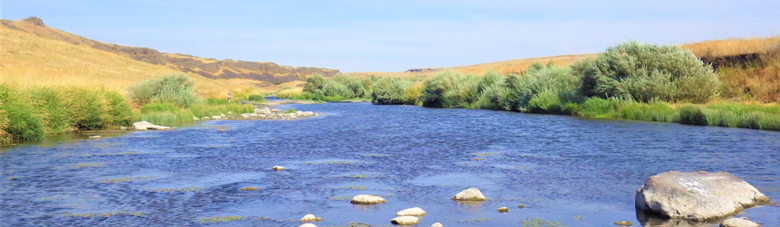
Palouse River provides habitat for fish and other aquatic species that rely on its continuous water supply.