

Watershed health — Coastal Region update
We investigated the health of stream habitats in the Coastal Status and Trends Region in 2010, 2014, and 2022. From these three years of sampling, the region showed moderate biological conditions and high rates of poor bed stability.
Use the map to navigate our reports by Status and Trends Region.
Regional summary
- Benthic Index of Biotic Integrity habitat condition scores were consistent in the Coastal Region, with fewer than one third of streams classified as being in poor biological condition.
- The most prevalent indicators for streams in the Coastal Region were poor relative bed stability, low dissolved oxygen, elevated sand/fines, and elevated nitrogen concentrations.
Biological condition
Invertebrate biological condition of streams did not change substantially from 2010, 2014, and 2022. In all rounds of sampling, less than one third of stream kilometers were in poor biological condition. Streams designated as good and fair remained around one third of the total stream kilometers sampled throughout the three sampling years.

We used B-IBI ratings from 2010, 2014, and 2022 to obtain the percentage of stream kilometers in good, fair, and poor conditions for the Coastal Region. Error bars represent 95% confidence.
Physical and chemical indicators
The Coastal Region has been sampled three times, giving us much more insight on trends in this region. The indicators for this region were categorized into "Physical Indicators" and "Chemical Indicators." Click the corresponding boxes on the graph below to view each category.
Physical indicators, like bed stability, percentage of sands or fines, residual pool depth, and average embeddedness, showed an increasing trend of poor conditions over time. Notably, the percentage of stream kilometers indicating poor bed stability was over 60 percent for 2010, 2014, and 2022.
Chemical indicators showed slightly more variable trends. High nitrogen levels and low amounts of dissolved oxygen indicated poor conditions for over 40 percent of stream kilometers in all three sampling years.
To interact with this graph to learn more about these indicators, hold your mouse over each bar.
This interactive graph shows the percentage of stream kilometers assessed with poor physiochemical conditions in the Coastal Region for 2010, 2014, and 2022. The x-axis represents the percentage of river extent in poor condition. Error bars show 95% confidence.
Flip through our field photos!
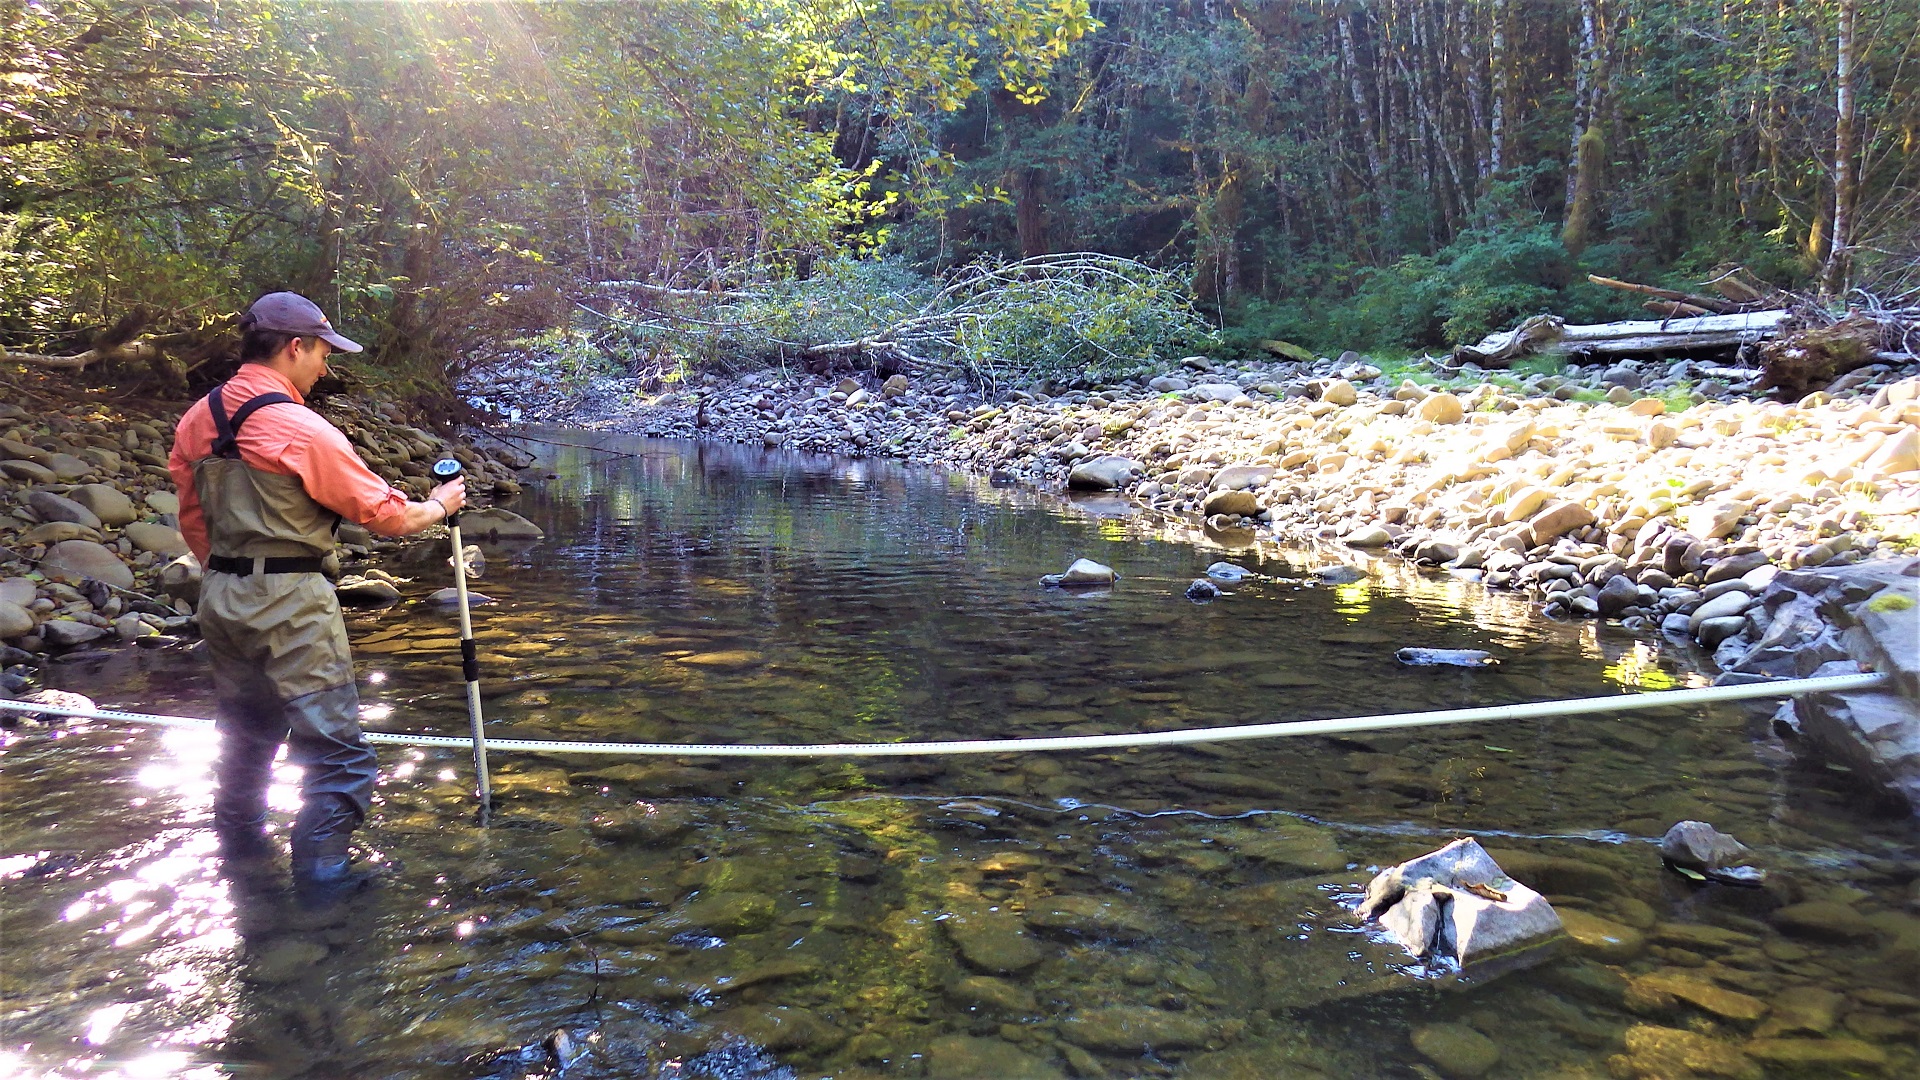
A crewmember measures the rate of flow at Stequaleho Creek.
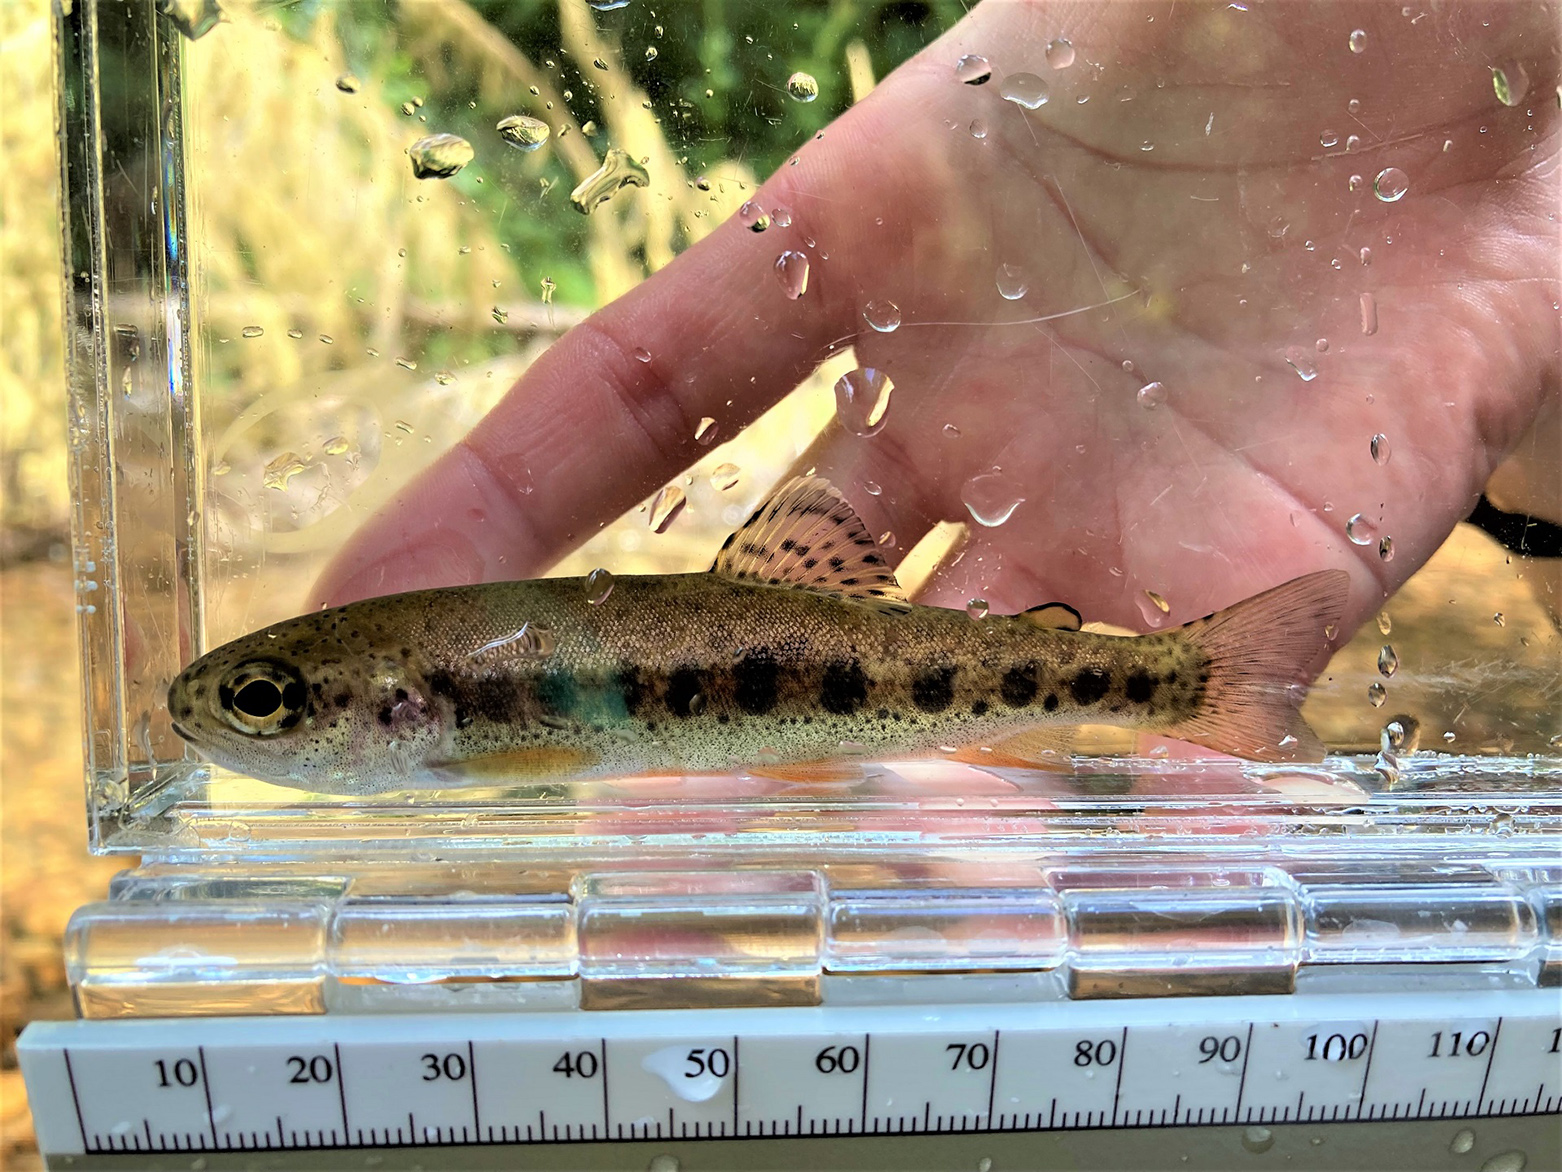
A juvenile rainbow trout is measured and recorded.
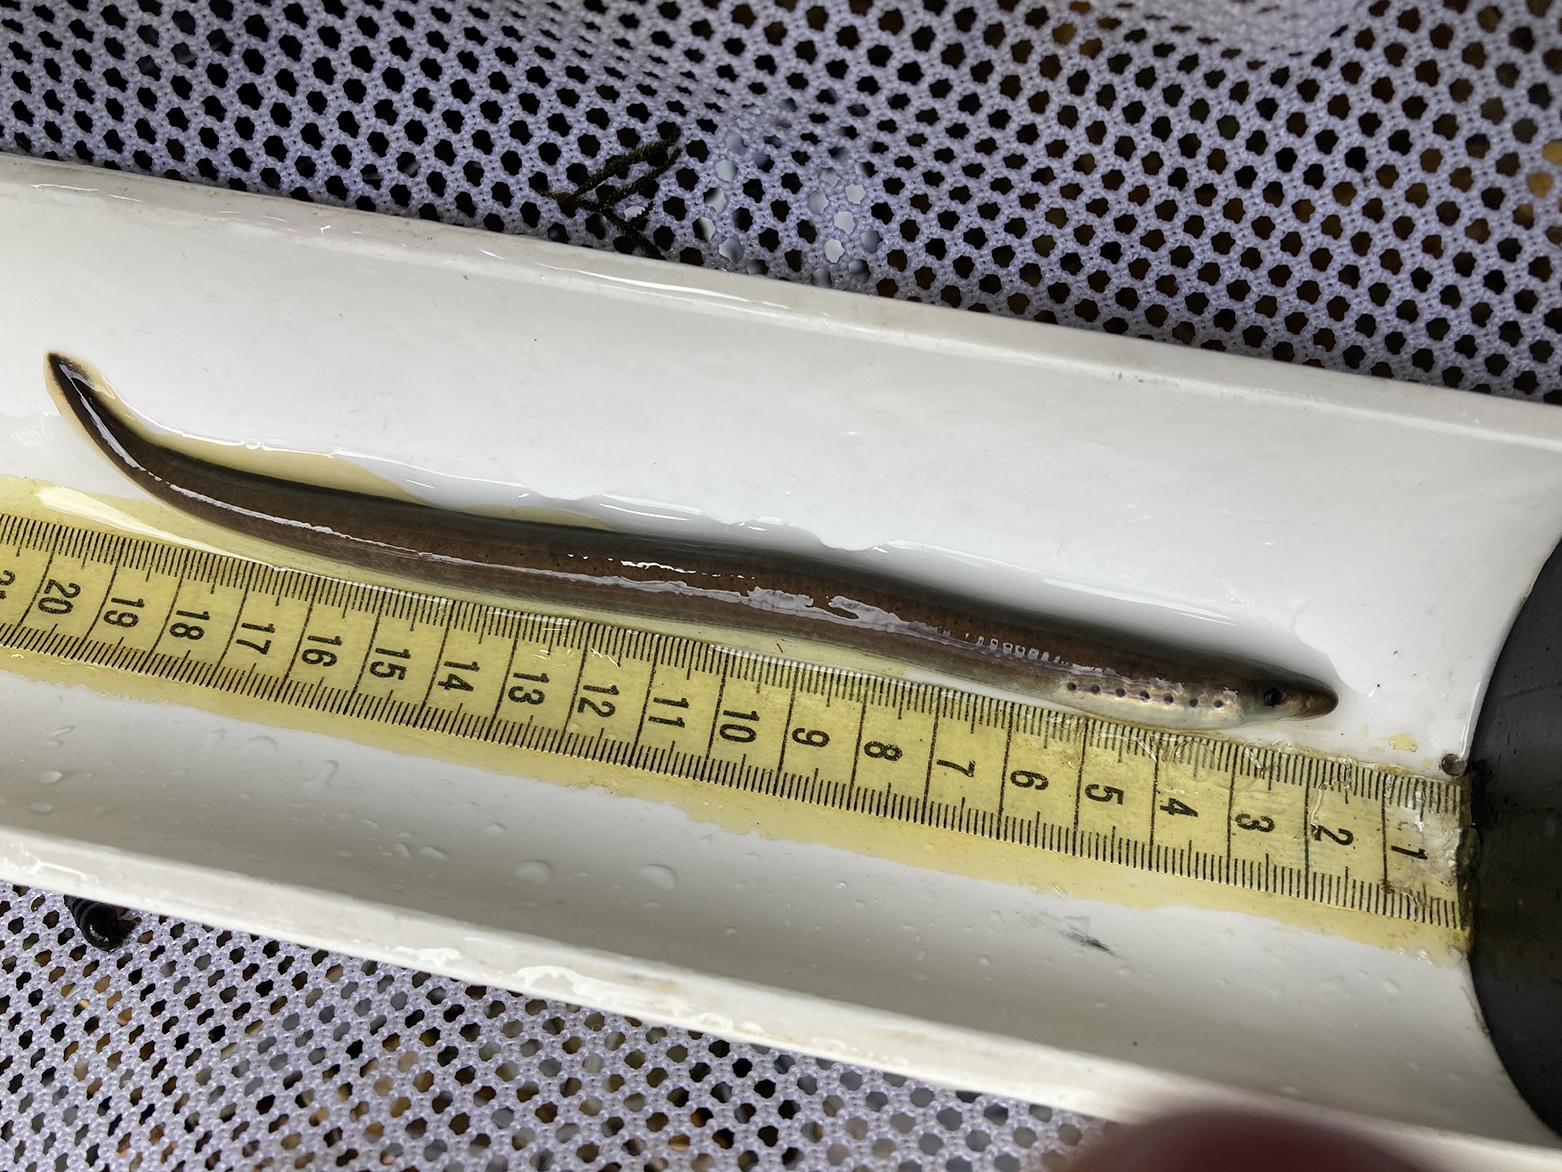
We measure the length of a juvenile lamprey from Ellsworth Creek.
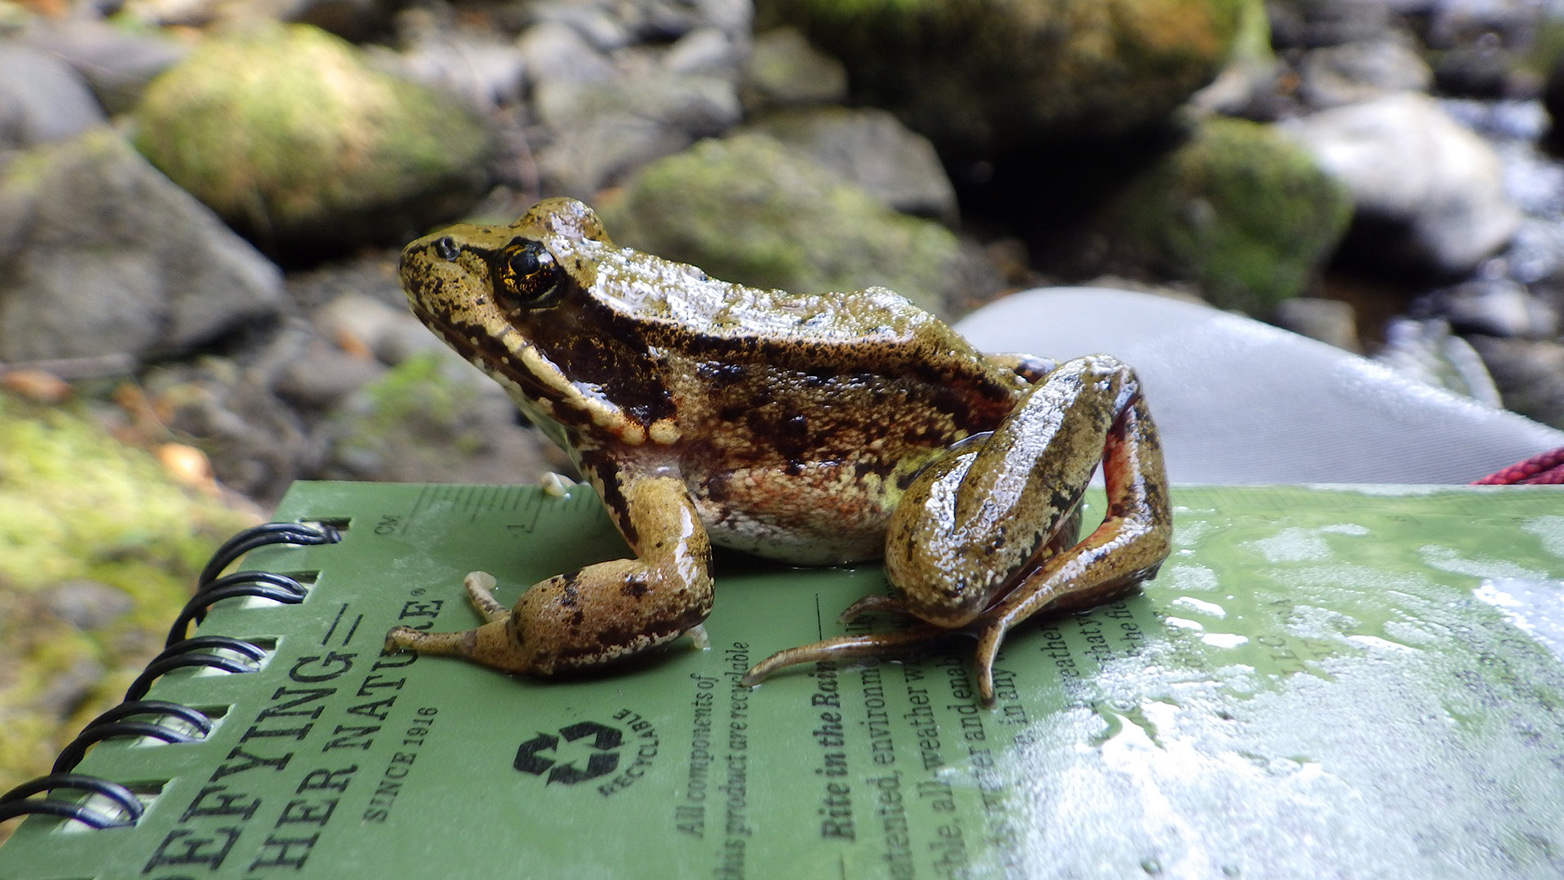
A northern red-legged frog from Christmas Creek poses for the camera.
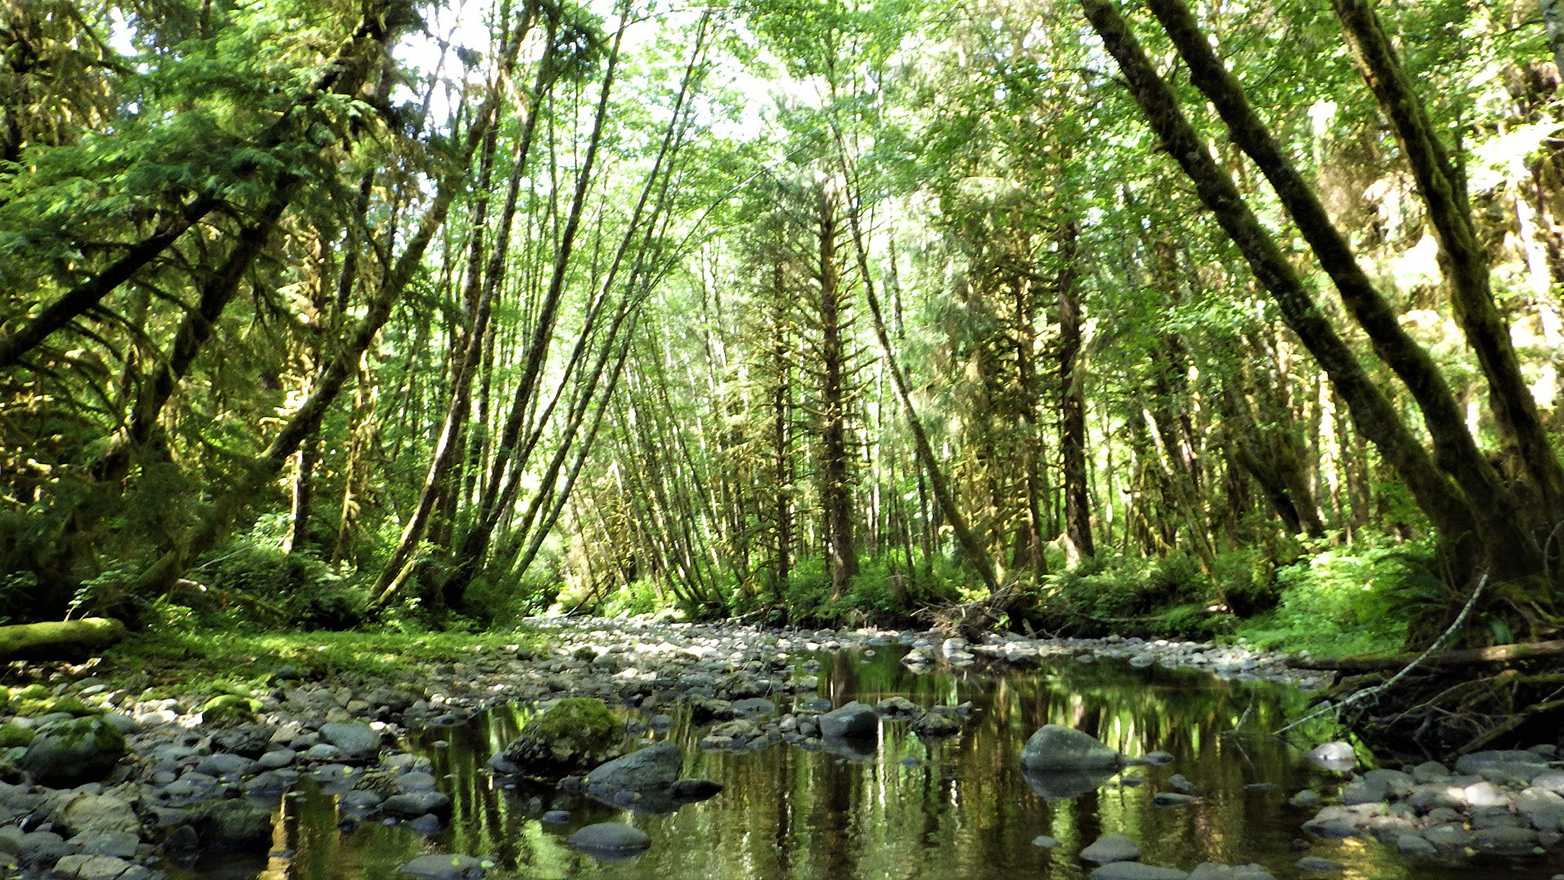
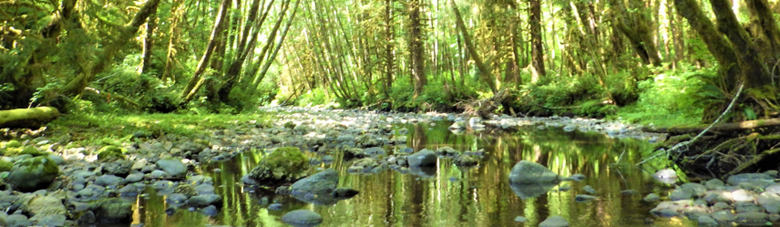
Christmas Creek has dense canopy cover from deciduous and coniferous trees.
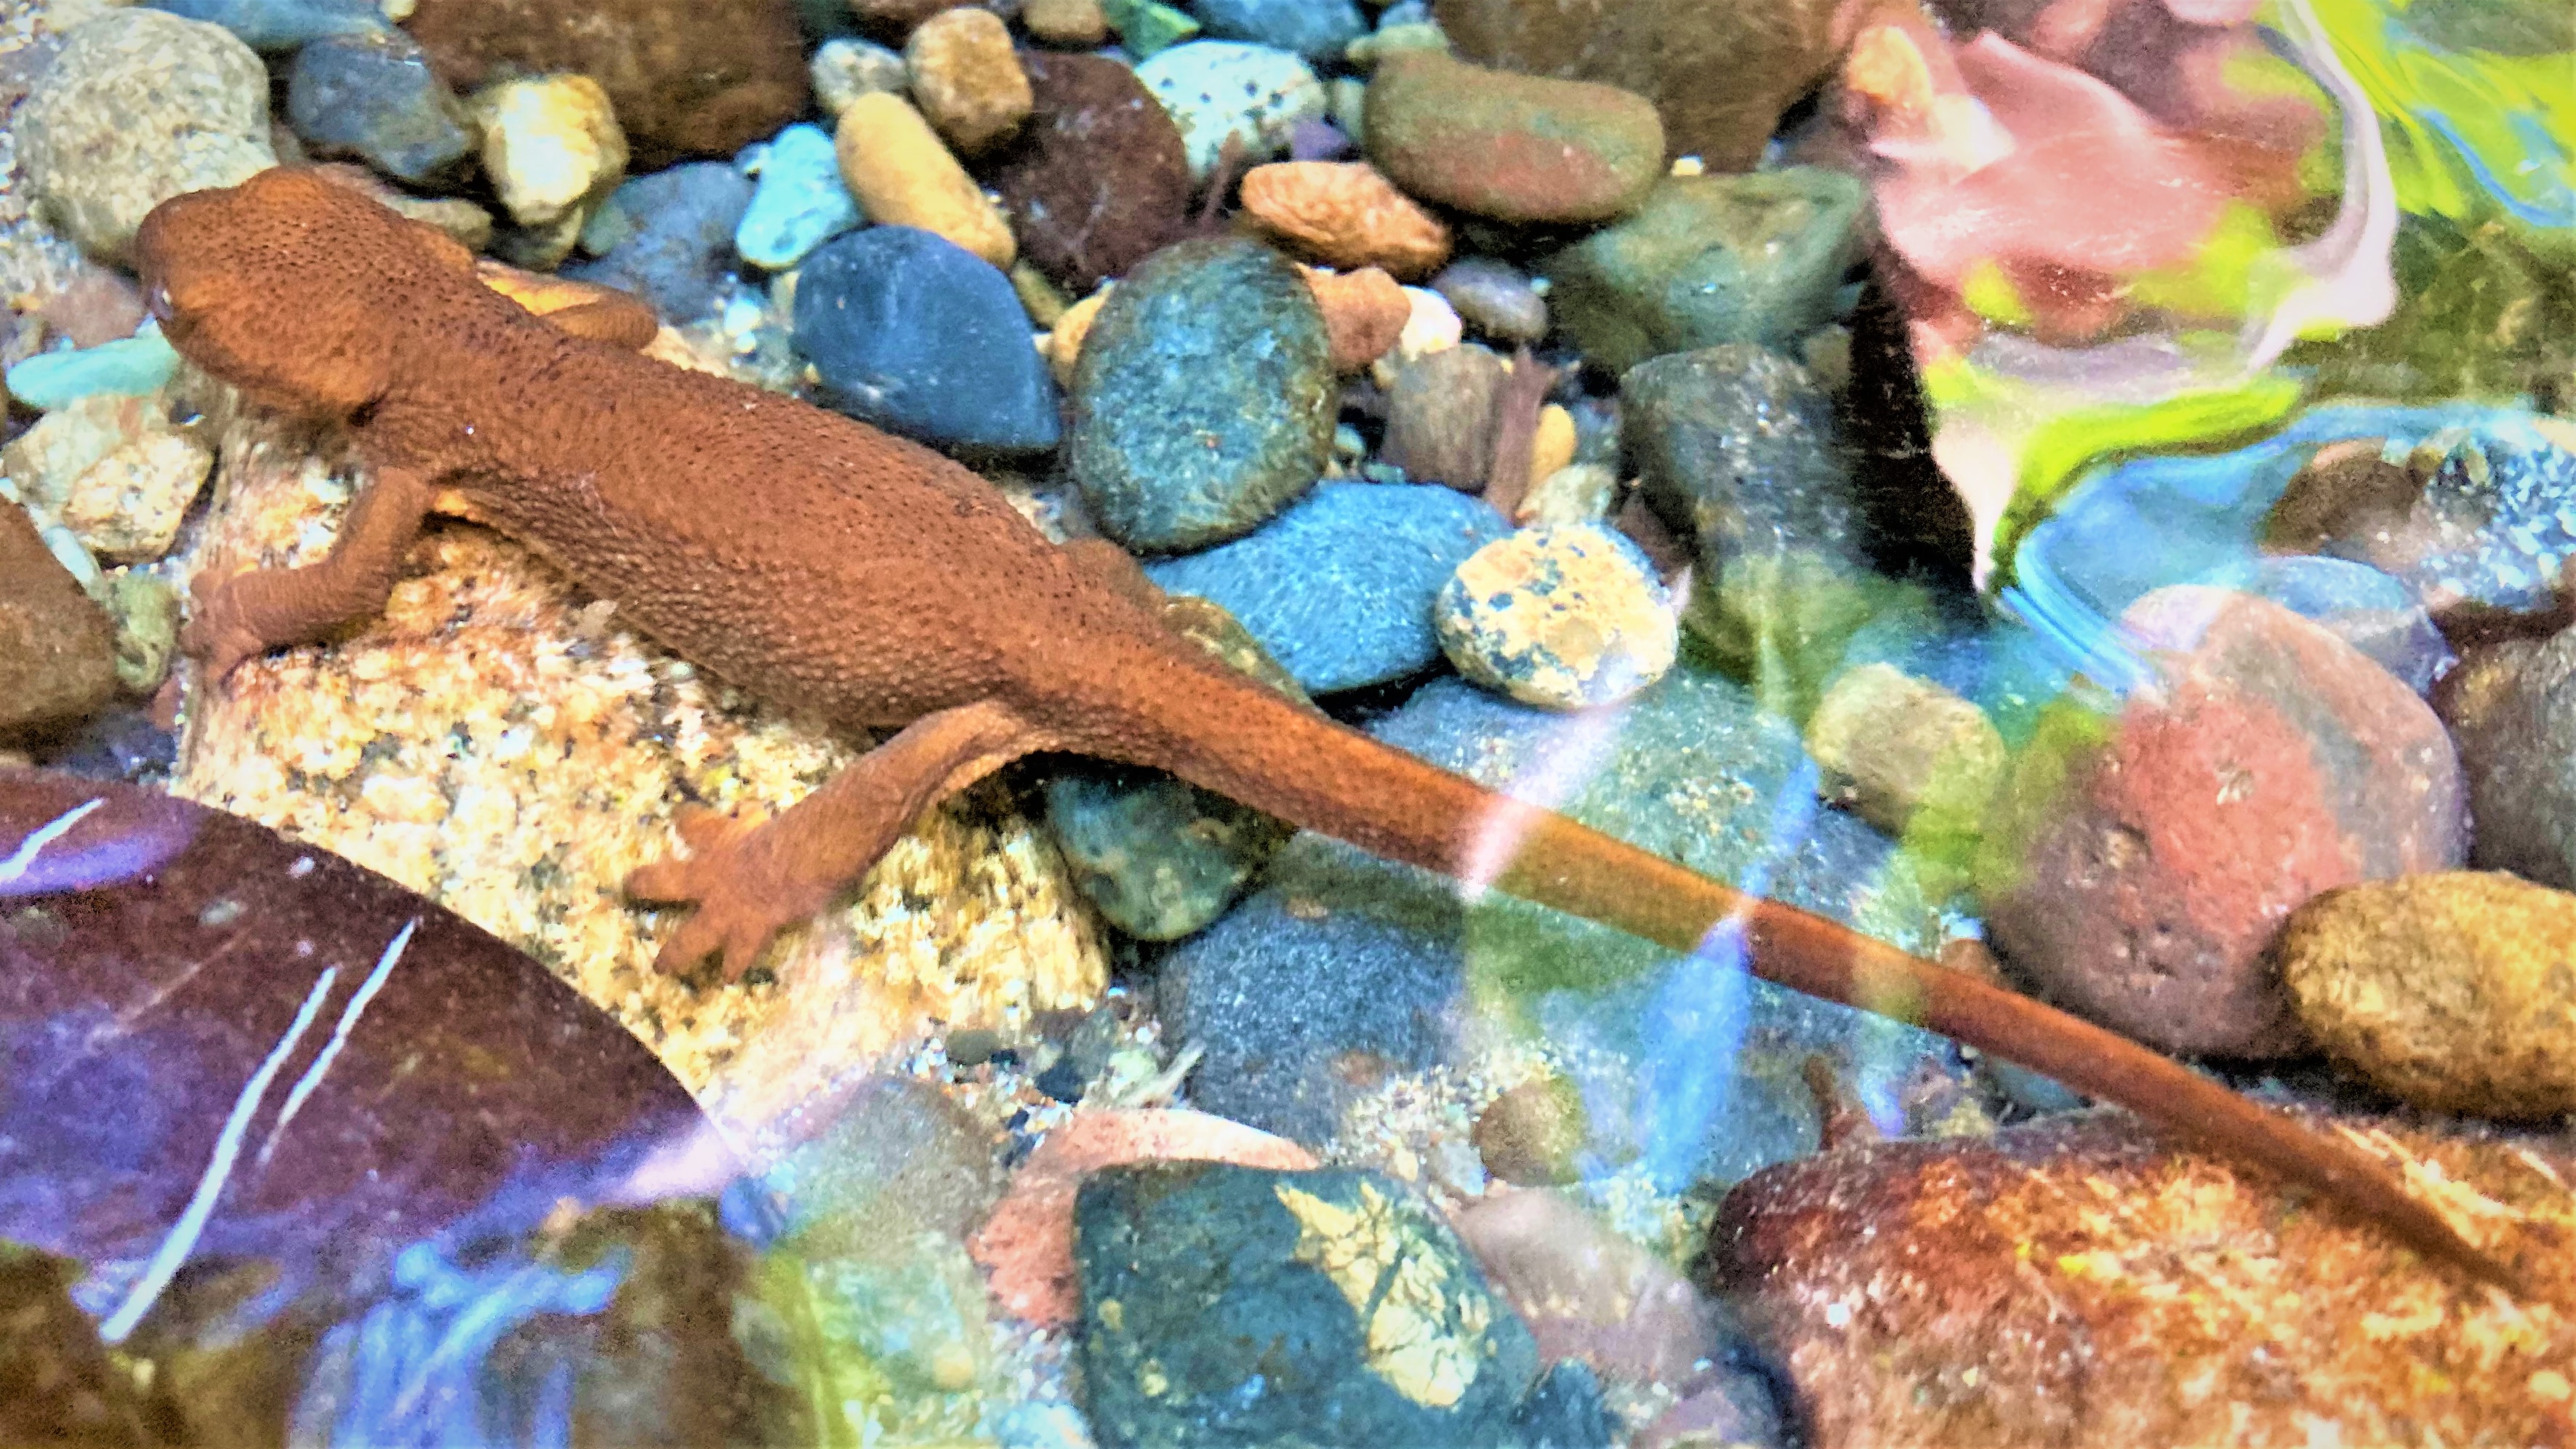
A rough-skinned newt camouflages in a stream in the Coastal Region.