

Watershed Health Monitoring by region
We survey habitat conditions in rivers and streams across nine Status and Trends Regions. Preliminary regional and statewide data are ready to share with our partners and the public.
Stream health trends by region
Explore our eight study regions to discover what we are learning about health of Washington's river and stream habitats. See text below the map for more study details.
Ecological indicators
Ecological indicators provide information about the ecological condition of a system. We use three types of indicators to gather information on the state of Washington’s waterways including:
- Physical indicators include stream substrate size, the amount of large woody debris, and the sinuosity of stream channels.
- Chemical indicators include dissolved oxygen, pH, and nutrient concentrations including phosphorous and nitrogen.
- Biological indicators include the benthic macroinvertebrate, algal, and fish community. We report on the benthic macroinvertebrate community in this report.
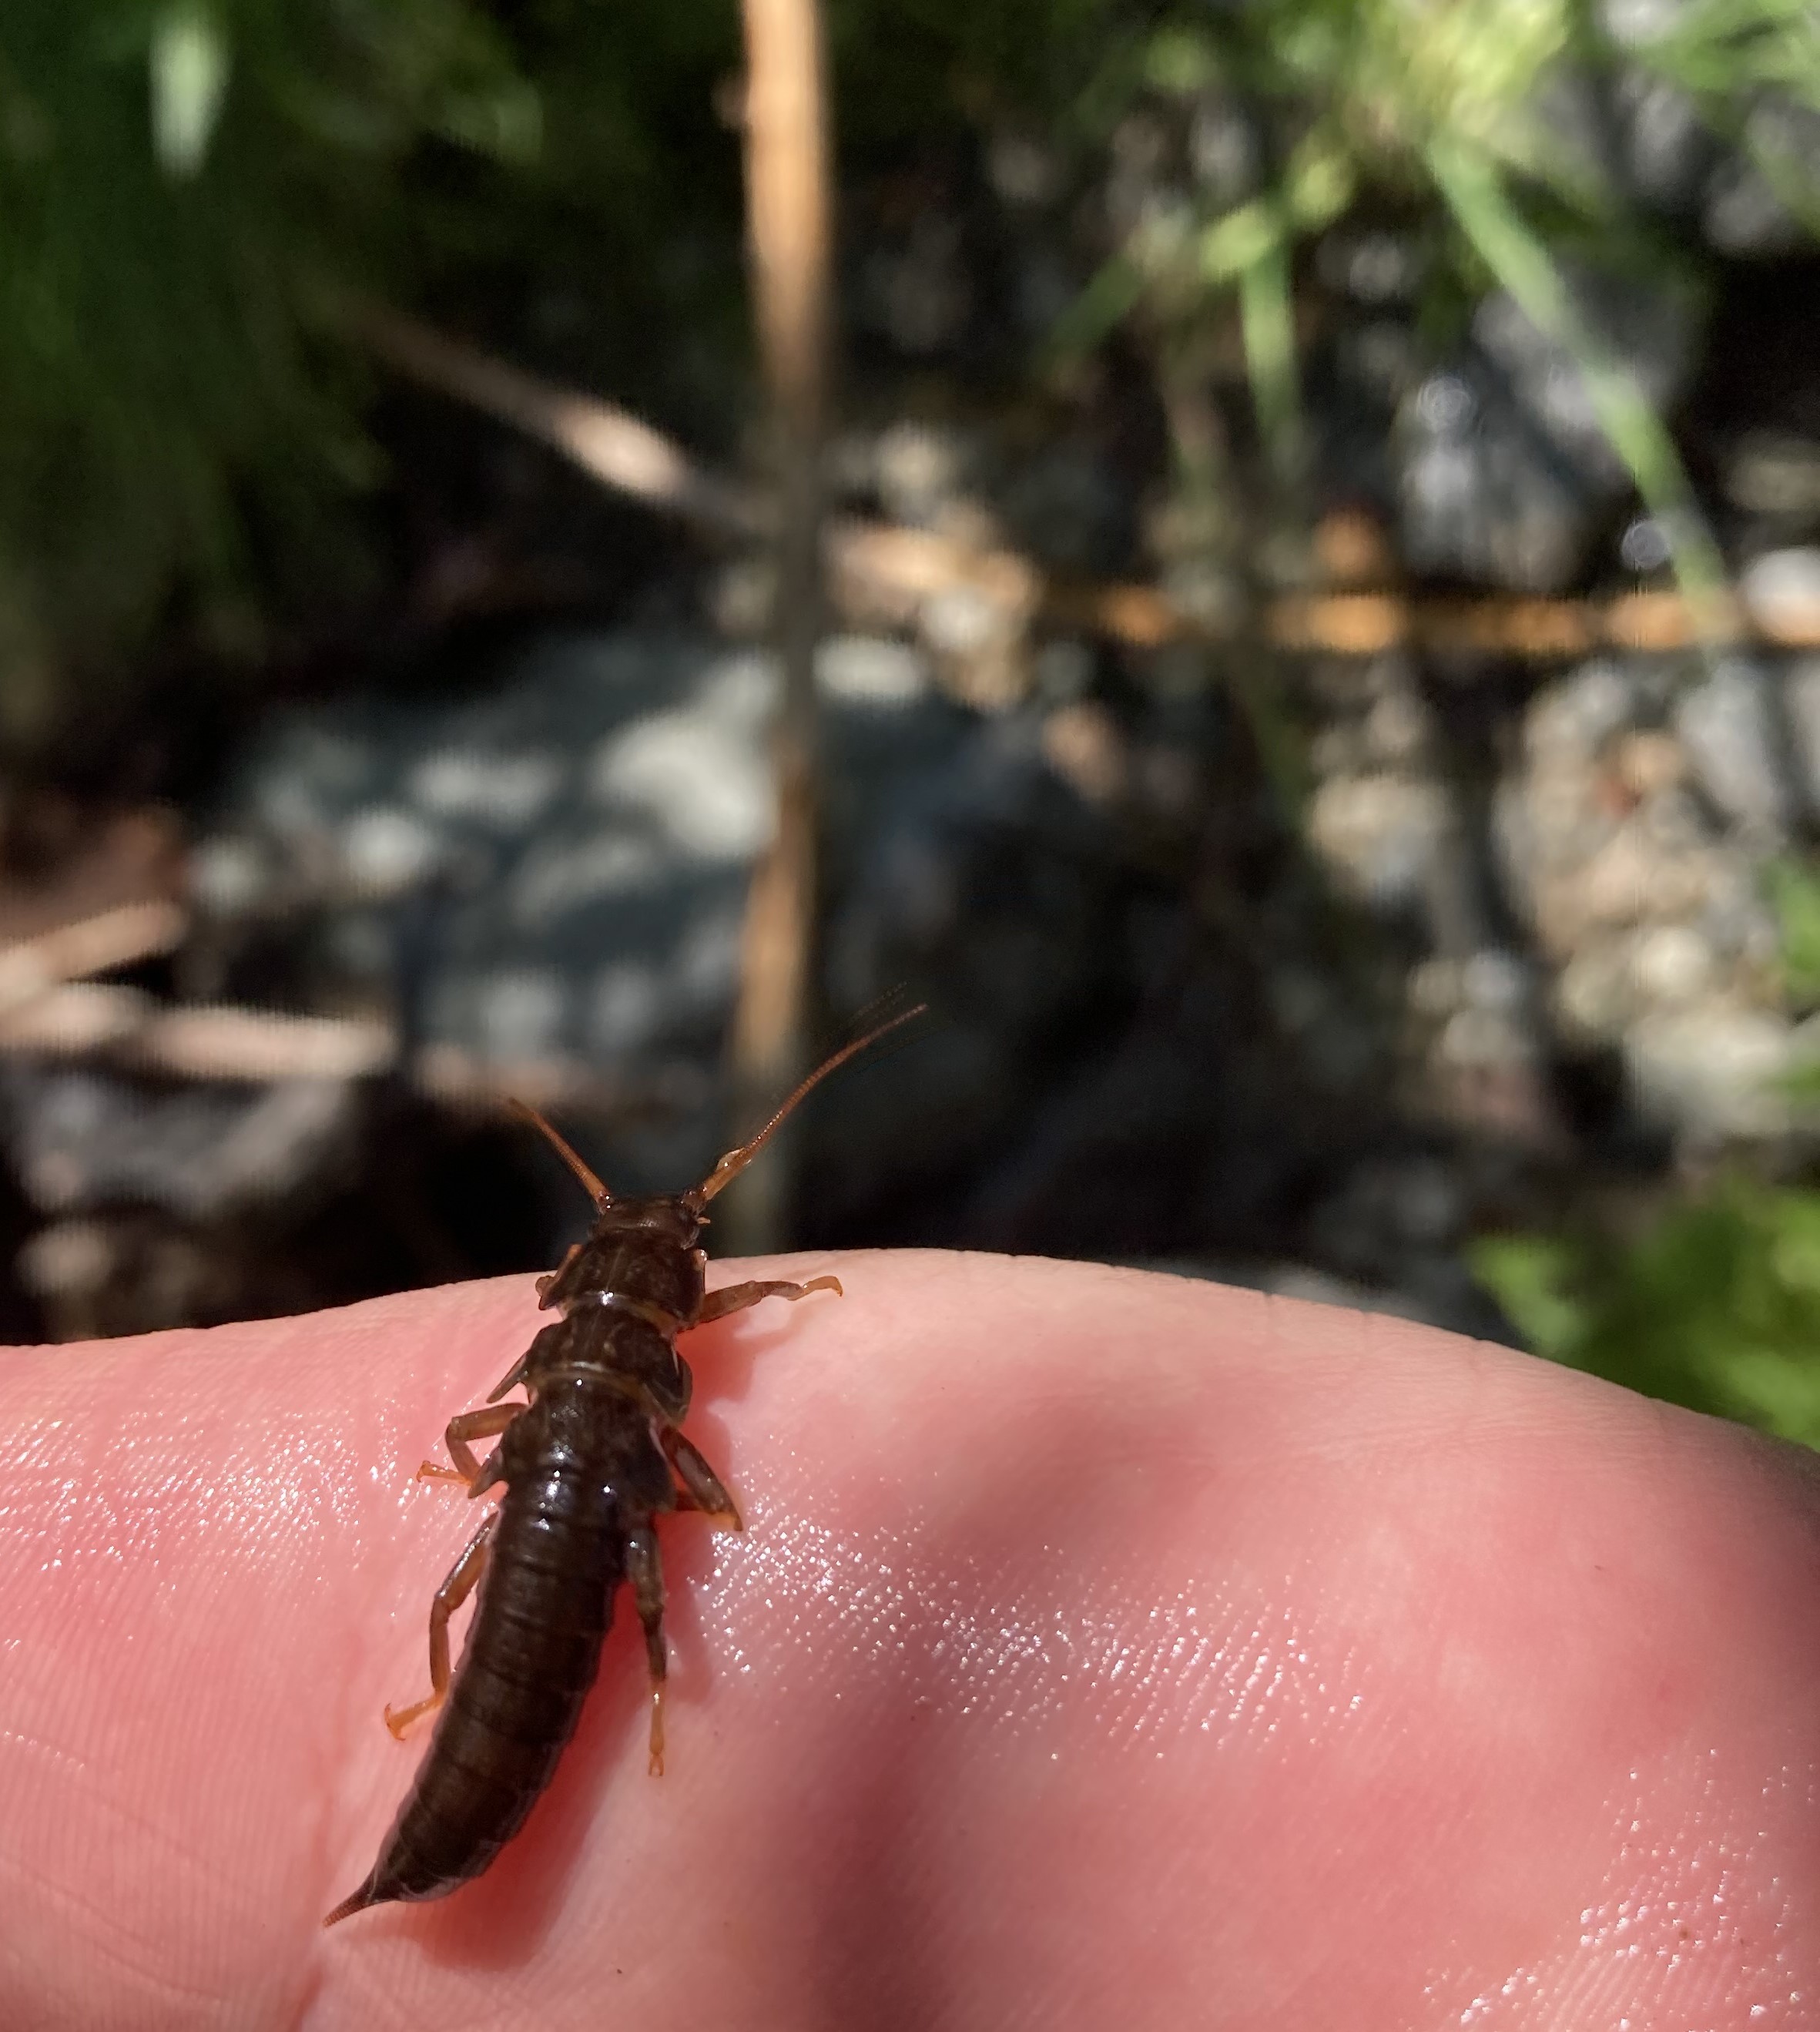
Stonefly (Plecoptera)
Benthic Index of Biotic Integrity
We use the Benthic Index of Biotic Integrity (B-IBI) as a biological indicator of Washington’s stream health. B-IBI is an important scoring system that uses dispersed samples of benthic macroinvertebrates to gauge the biological condition of streams. Benthic macroinvertebrates are “bugs” that live a part of their life cycle in the water and include insects such as mayflies, stoneflies, and caddisflies. Because of their aquatic lifestyle, and because they have varying sensitivity to stressors, benthic macroinvertebrates are a good indicator of stream condition.
Benthic macroinvertebrate samples are collected at randomly selected sites throughout the state. A score between 0 – 100 is given to each sample site based on what invertebrates are present or absent and in what quantities. The score is binned into three large categories: "good," "fair," and "poor." For each region, B-IBI categories are proportioned by stream length to estimate the overall stream health within the given sample area. A higher percentage of stream length in the "good" category suggests more healthy streams, while a significant percentage of "poor" stream kilometers suggests that the streams are in worse condition due to stressors in the environment.
Stressors
When a physical or chemical stressor is in poor condition, it can be a stressor on the ecosystem and ultimately have an adverse effect on the biology in the system, such as a poor B-IBI score. We identify physical and chemical stressors by identifying indicators that are in poor condition when compared to thresholds set by our reference sites.
It is important to note that stressors and the ecosystem response are measured in a small section of stream, but the origin of the stressor can be streamside (e.g., runoff from a road) or come from many miles away (e.g., acid rain from industry). Ultimately, many of the stressors found in stream ecosystems can be traced back to human activity.
In each regional report, you will see the percentage of river kilometers in poor condition found in that region for a variety of indicators. Indicators are reference measurements from our study that point towards the most common stressors within each region. The indicators highlighted in these reports have high percentages of sampled stream lengths that are rated as poor. By highlighting the biggest proportions of poorly rated indicators, the common stressors specific to each region are displayed.
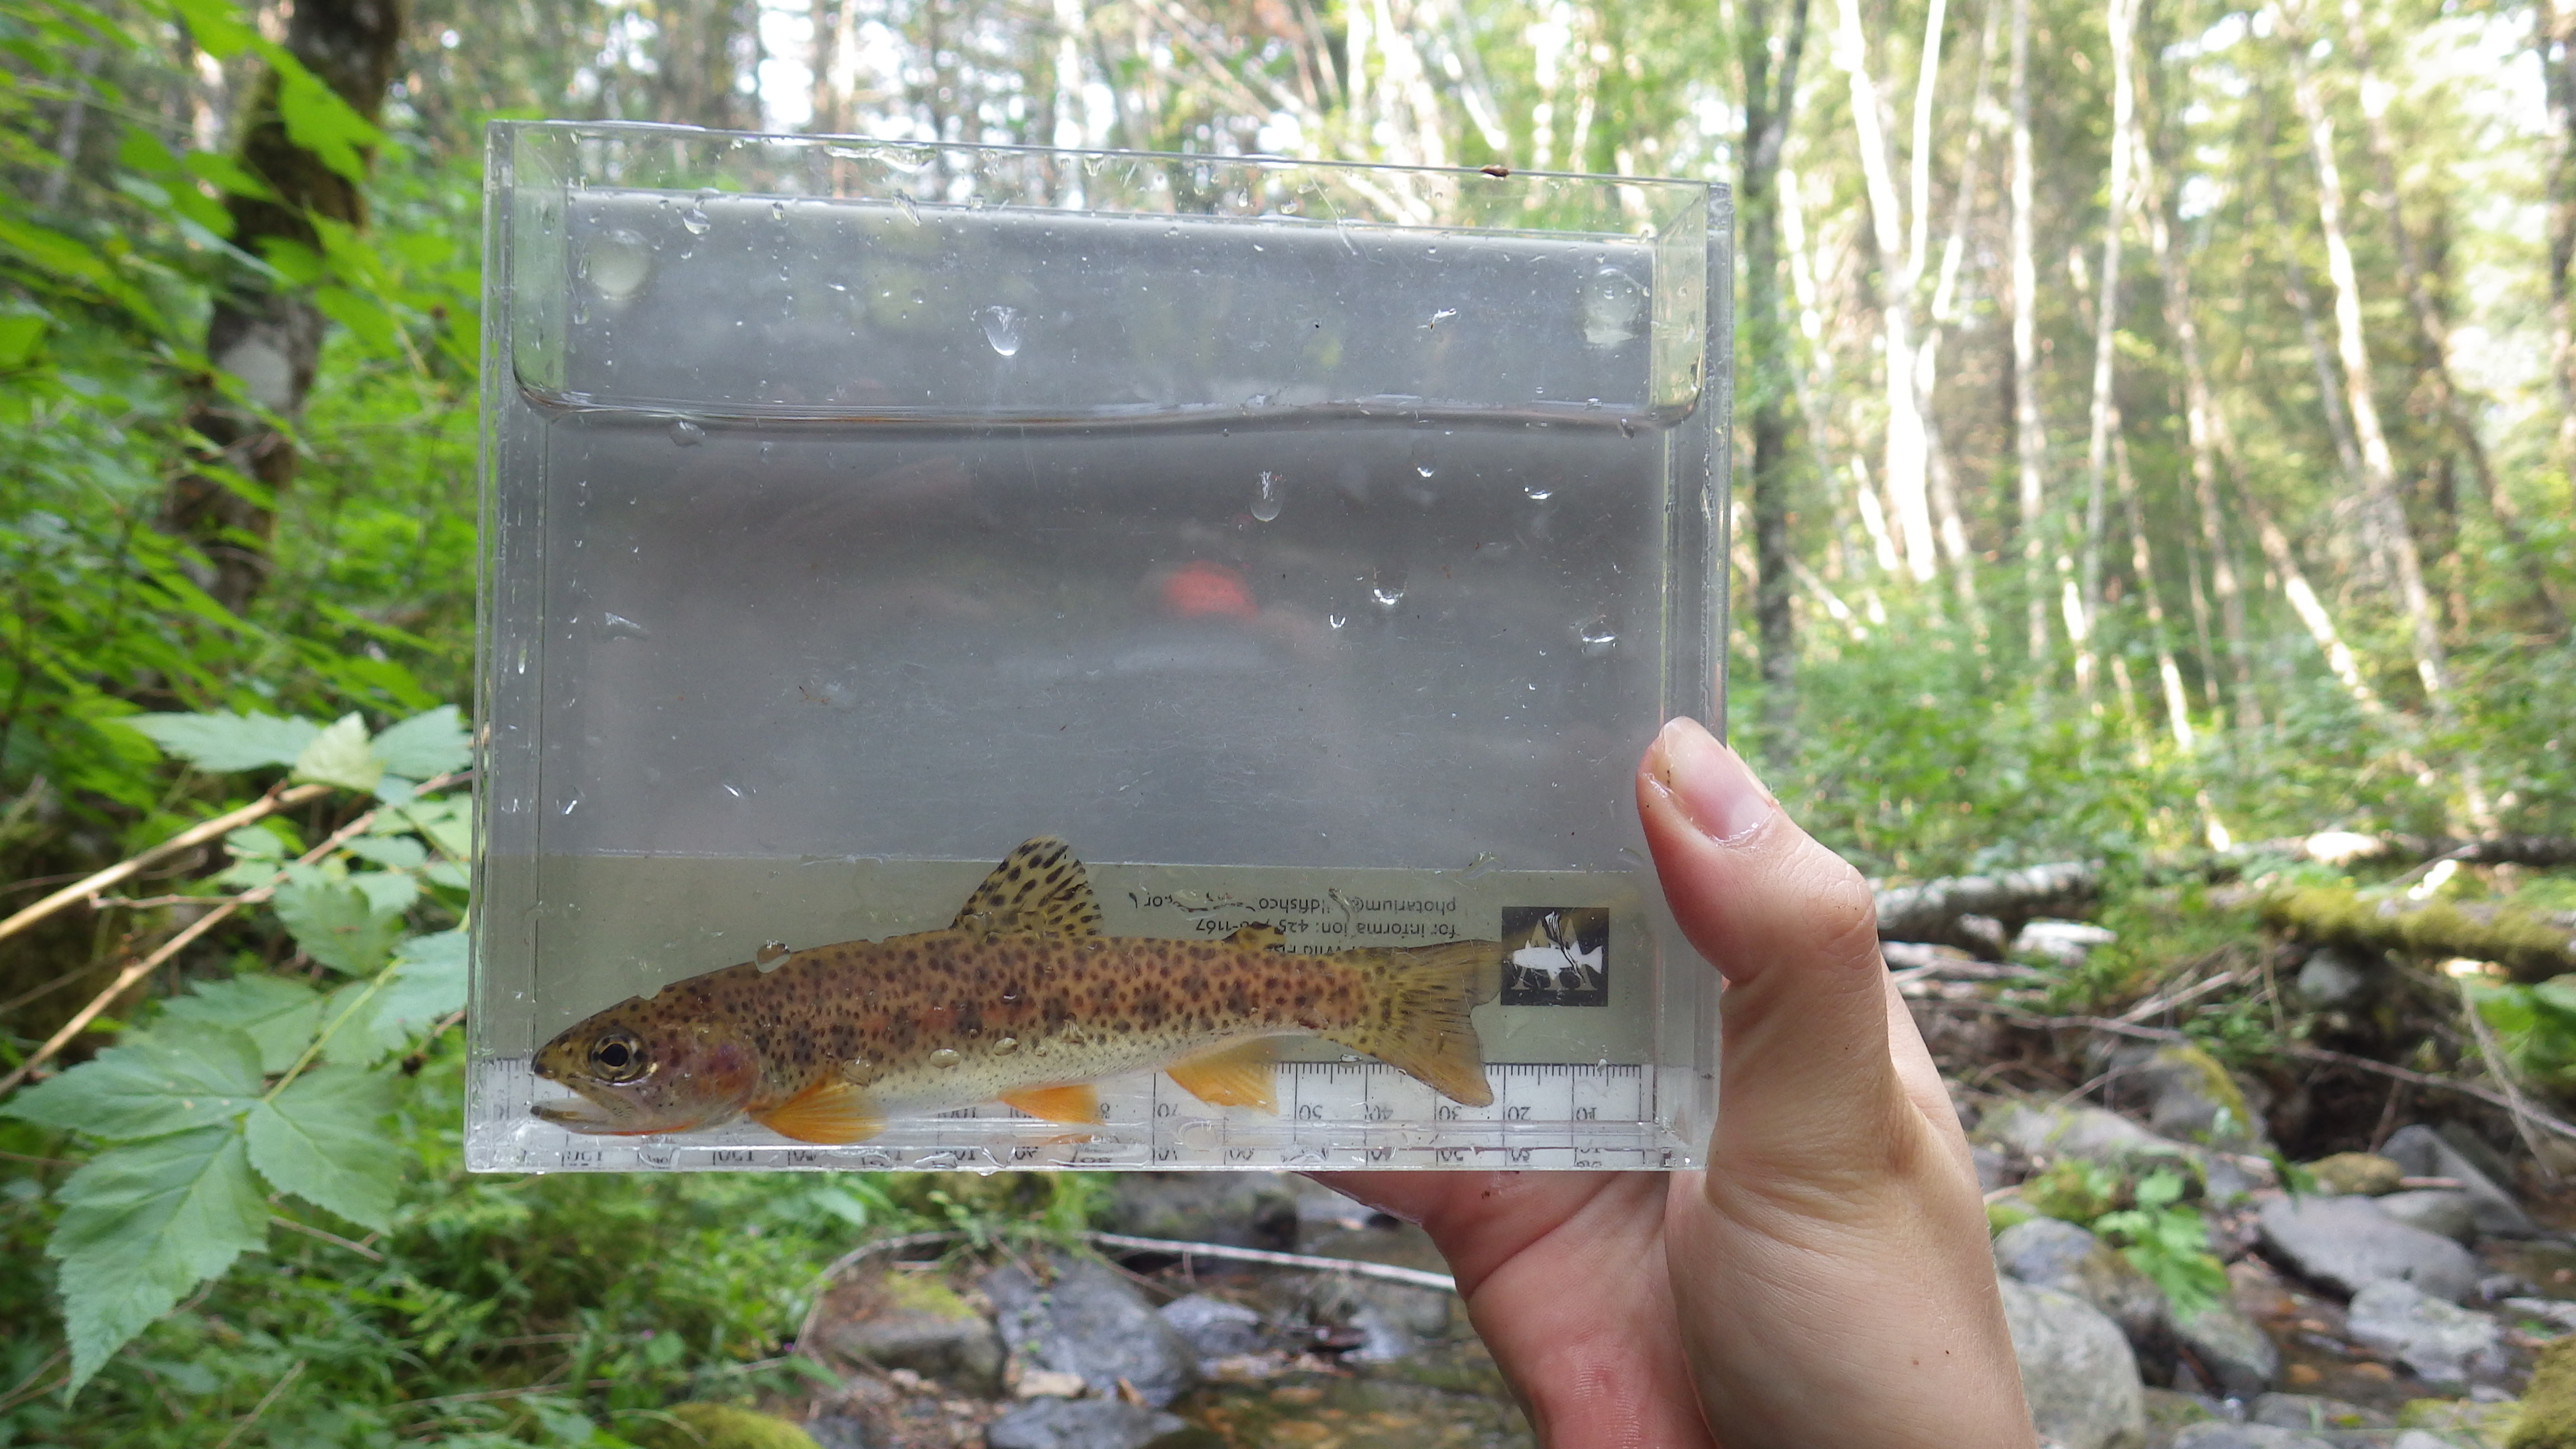
Cutthroat trout (Oncorhynchus clarkii)
Related links
Contact information
Edward M. Krynak
Watershed Health Monitoring Lead
edward.krynak@ecy.wa.gov
360-742-1581